
Posts by ooistaff
Anomalous Shallow Strong Currents Off the Oregon Margin
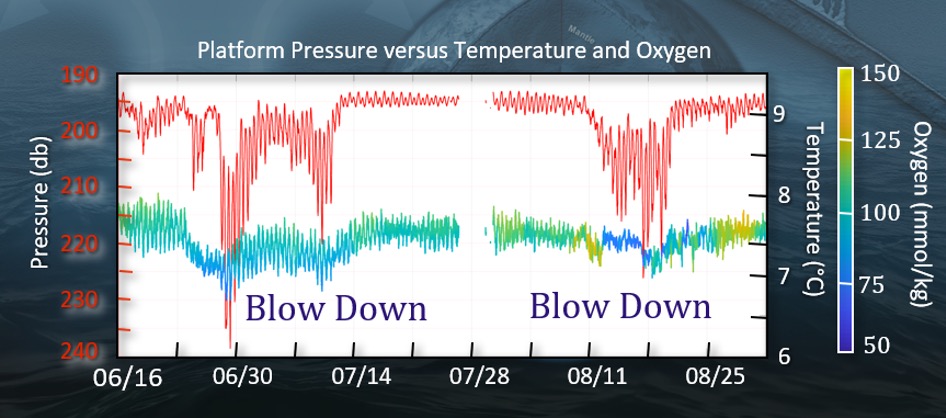
Blow down of the 200-meter Shallow Profiler Mooring Platform 2019
K. Roseburg and W. Ruef, Regional Cabled Array and P. MacCready, University of Washington, 20 August 2019
In June and August, 2019, the Slope Base Shallow Profiler Mooring was impacted by two substantial “blow down” events: these were the first observances of blow downs since the moorings were installed in 2014. The largest of these events, which occurred near the end of July and which lasted over two weeks, resulted in a deepening of the 12 ft across, 7,000 lb. platform nearly 50 m and migration of the platform ~ 150 m to the west. Results from pressure, ADCP, temperature and oxygen data pulled from CI using M2M, indicate that as the currents strengthened, the float was depressed into ~ 0.25-0.50°C cooler water with slightly decreased oxygen concentrations. An evaluation of the eddy kinetic energy calculated from the ADCP data, does not support eddy-driven water mass transport. The lower oxygen concentrations could reflect lower amounts of photosynthesis as the platforms are pushed deeper into the water column. We do not know of other documented blow down events such as these in the PNW.
Read MoreFirst Continuous Temperature Measurements Spanning >2600 m water depth

Deep temperature modulations at Axial Base
From Interactive Oceans Data Portal, 21 July 2019
Axial Base is the only site in the world’s oceans where continuous full water column measurements are being made, spanning >2600 m to ~ 5 m beneath the oceans’ surface (a & b). The Axial Base Deep Profiler (DP) Mooring has been operational for >17 months, completing two profiles a day from ~2650 m to 127 m (b). Since August 2019, DP vehicle measurements overlap with those made by instruments on the Shallow Profiler Mooring, which conducts nine profiles a day (a): since 2015, the three Shallow Profiler science pods have conducted >40,000 profiles. The high-resolution temperature measurements delineate fine scale structure both in shallow waters and below 1000 m water depth (c&d) marked by regular vertical striations . These perturbations may result from the vertical advection of the temperature field by passing semidiurnal internal tides (D. Luther, pers. com). Some modulations may be wind-driven inertial waves. Examination of dissolved oxygen concentrations during this same time period are not consistent with drawdown caused vehicle movement. Additional analyses are required, however, to unequivocally determine the processes responsible for these perturbations. A Jupyter notebook on the UW interactiveoceans data portal is now developed to analyze MODIS satellite data (chlorophyll) with measurements being made by instruments on the Shallow Profiler mooring (interactive oceans.washington.edu).
Read MoreOOI moorings provide sustained observations of the Irminger Sea Deep Western Boundary Current
Data from the Ocean Observatories Initiative (OOI) Global Irminger Sea Array contributed to the longest continuous record of total volume transport of water in the Deep Western Boundary Current. This current, in the subpolar North Atlantic, travels southwest along the continental slope off of Greenland and is considered a significant part of the global climate system.
In a recent Journal of Geophysical Research Letters: Oceans paper, Dr. Joanne Hopkins at the National Oceanography Center in Southampton, U.K., and collaborators used data from two U.S. OOI flanking moorings, along with three U.S. Overturning in the Subpolar North Atlantic Program (OSNAP) East Greenland Current array moorings, and five U.K. OSNAP moorings to study the total amount of water moved by the current over a period of two years, as well as its daily and seasonal variability.
The data used for this paper was gathered over 22 months between 2014 and 2016, while all 10 of the moorings were in the water for the same period. Previous research to determine transport estimates at this latitude have been limited by a sparse number of direct and sustained measurements, relying instead on measurements over 9.5 months, 60 days, and “snapshot” or repeated summertime hydrographic sections.
Hopkins et al estimate that the Deep Western Boundary Current transports an average of 10.8 × 10⁶ m3 of water per second with variation in time. In addition, the transport variability shifts from high to low frequencies with distance down slope. While the results did suggest an increase in transport since 2005-2006, they did not conclude that there was a significant long-term trend, given the limitations of previous data sets.
The location of the OOI Global Irminger Sea array was selected as part of an effort by the scientific community to place moorings in areas that have been historically under-sampled and subject to high winds and sea states that make frequent ship-based measurements difficult. The OOI Data Portal provides access to data from the Irminger Sea Array dating back to the initial installation in September 2014.
Read MoreNSF Science in the Deep with ROV Jason

NOTE: Video of this event available here. Fast forward to about 52:00 to get past the distorted audio.
The National Science Foundation will host “Science in the Deep,” a Facebook Live event with researchers aboard R/V Atlantis on Wednesday, June 26, from 1:00-2:00 p.m. Eastern. The Atlantis team will be off the coast of Oregon servicing parts of the Ocean Observatories Initiative Regional Cabled Array using the remotely operated vehicle (ROV) Jason, which is expected to be 800 meters deep at Southern Hydrate Ridge, where methane bubbles from the seafloor and life flourishes.
Join NSF host Deena Headley as she speaks with OOI Research Scientist Michael Vardaro and Research Scientist/Eng2 Katie Bigham, both from the University of Washington, about their work on the recent cruises off the U.S. Northwest Coast, live views from Jason on the seafloor, and life at sea.
Read MoreNew Estimate of Boundary Current Transport

From Hopkins et al., 23 April 2019
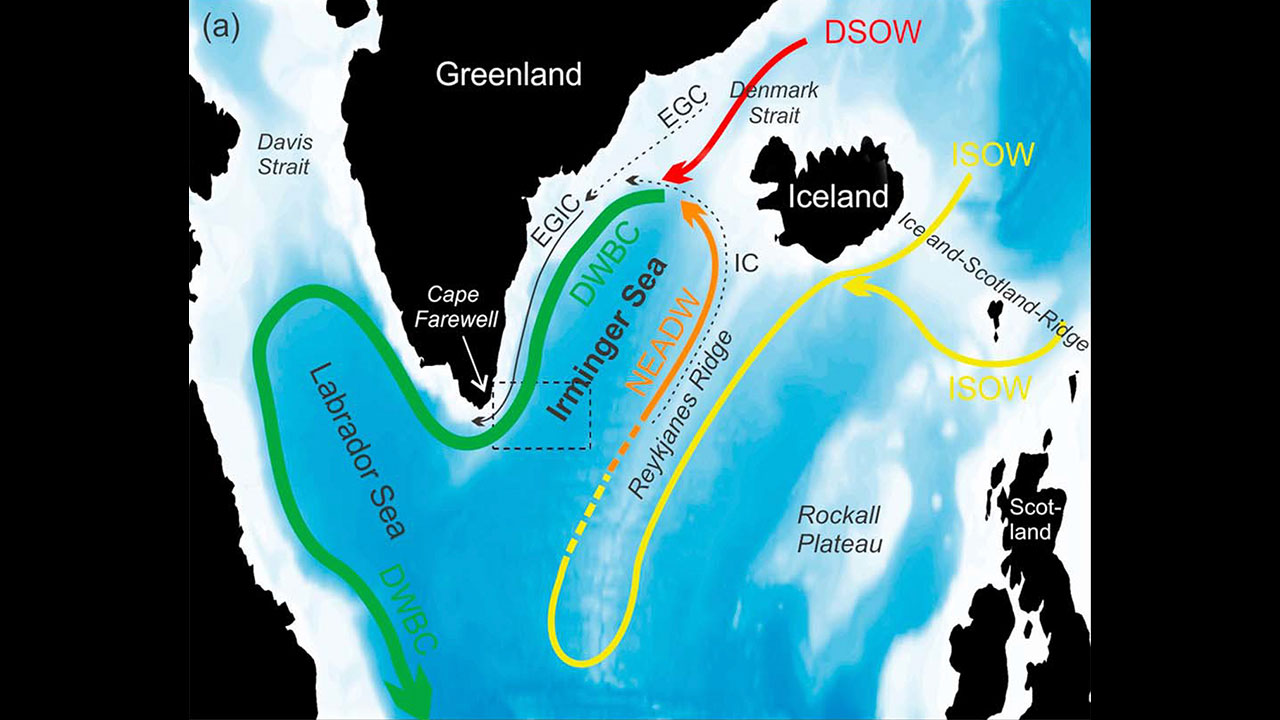
Hopkins et al., 2019 use data from the OOI Irminger Sea flanking moorings to create the longest continuous record to date of Deep Western Boundary Current (DWBC) volume transport in the region. This study, part of the Overturning in the Subpolar North Atlantic Program (OSNAP), used data from two OOI flanking moorings, along with three U.S. OSNAP moorings, and five U.K. OSNAP moorings to determine the 22-month mean DWBC volume transport, and its spatial structure off Greenland (Figure above).
Determining DWBC properties is critical to understanding the transport of heat, salt, nutrients, and carbon by the Atlantic Meridional Overturning Circulation (AMOC), part of a system of currents that form the global thermohaline circulation. The combined OSNAP/OOI mooring array deployed at 60°N in the Irminger Sea during 2014 – 2015 provides the longest continuous record of DWBC volume transport at this latitude. This enables not only the most reliable estimate available of the mean transport, but the ability to investigate temporal variability.
Several key points are made by the authors. First, the average volume transport of deep water was 10.8 ± 4.9 Sv (mean ± 1 std) to the south. Of the total transport, North East Atlantic Deep Water accounted for about 6.5 Sv while about 4.1 Sv was associated with the Denmark Strait Overflow. Second, the long record allows the first systematic investigation of DWBC variability. The observed transport shows a shift from high to low frequency fluctuations with increasing distance from the East Greenland coast. High‐frequency fluctuations (2–8 days) dominate close to the continental slope, likely associated with topographic Rossby waves and/or cyclonic eddies. In deeper water, transport variance at 55 days dominates. Finally, the results indicate a modest (1.8 Sv) increase in total transport since 2005–2006, but this difference can be accounted for by a range of methodological and data limitation biases. This is of interest because although AMOC variability related to climate change is expected to be reflected in DWBC transport and properties, conclusive observational evidence of transport change has been elusive.
Read MoreOpportunity to provide feedback on OOI Data Delivery Systems
We need your help evaluating Ocean Observatories Initiative (OOI) data delivery systems and to assess the extent to which they meet the needs of the user community. The information we gather through this survey will be used to improve the current OOI data delivery systems and perhaps develop other systems that better meet the needs of users. We want to know what you think of the OOI data delivery systems and how they could be improved for users.
The survey should only take about 15 minutes to complete. Your participation is voluntary and your responses are anonymous. Click here for the OOI Data survey
Please complete the survey by April 26th. This survey is being conducted by the NSF’s OOI Facility Board’s Data Dissemination and Cyber Infrastructure (DDCI) Committee. If you have any questions, please contact Tim Crone.
Thank you very much for your time and feedback.
Regards,
Tim Crone, DDCI Committee Chair & Larry Atkinson, OOIFB Chair
A Community Welcome from The OOI 2.0 Team
A Community Welcome from The OOI 2.0 Team
The Ocean Observatories Initiative team is excited about implementation of OOI 2.0 and advancing this community facility over the next five years. Phase two of OOI began October 1, 2018 following the award by the National Science Foundation of a cooperative agreement to Woods Hole Oceanographic Institution (WHOI) to host the Program Management Office. Operations and maintenance of observatory components remains as before with WHOI operating the Global sites and the Pioneer Array, the University of Washington (UW) operating the Regional Cabled Array, Oregon State University (OSU) operating the Endurance Array, and Rutgers, the State University of New Jersey operating the cyberinfrastructure that ingests and delivers data. One important change in OOI 2.0 is that the data assessment responsibilities, formerly at Rutgers, are now distributed among the marine operating institutions to provide better integration with the science and engineering teams, as OOI 2.0 puts renewed emphasis on data QA/QC and data access.
[media-caption type="image" path="https://oceanobservatories.org/wp-content/uploads/2019/01/PioneerSurfaceMooring-300x184.jpg" link="#"]Figure 1. The Multi-Function Node of a Pioneer Surface Mooring prepared for launch on the fantail of the R/V Armstrong. Pioneer Array moorings are recovered and replaced with refurbished components twice per year. (Photo credit: OOI CGSN)[/media-caption]The Global Array infrastructure deployments at the Irminger and Papa sites are ongoing – entering their 5th and 6th year of operation, respectively. OOI operations at the Irminger Sea Array are conducted in coordination with the NSF Overturning in the Subpolar North Atlantic Program (OSNAP), while OOI subsurface moorings and gliders at Papa are deployed in coordination with a surface mooring from NOAA’s Pacific Marine Environmental Laboratory. Deployments with reduced scope, consisting of a surface mooring only, are being conducted at the Southern Ocean Array in collaboration with the National Oceanography Centre (NOC), Southampton, UK. Operations at the Argentine Basin Array have been suspended. The Pioneer Array (Figure 1), serviced twice per year, is preparing for its 12th mooring service cruise. Several community PI projects have leveraged the Pioneer Array infrastructure, including the New England Shelf Long-Term Ecological Research (LTER) program. Observations from Pioneer, in conjunction with remote sensing and historical data, have highlighted new shelf-slope exchange mechanisms within a rapidly changing physical system with significant impacts on ecosystems.
[media-caption type="image" path="https://oceanobservatories.org/wp-content/uploads/2019/01/EnduranceArray-300x169.png" link="#"]Figure 2. The September 2018 Endurance Array cruise occurred during the transition to OOI 2.0. We recovered equipment deployed in March 2018, deployed newly refurbished equipment and continued delivering data to the OOI Data Portal. (Photo credit: OOI OSU)[/media-caption]The Endurance Array (Figure 2) includes moorings, profilers and gliders off Oregon and Washington. The infrastructure off Oregon is tied into the Regional Cabled Array at the shelf and offshore locations. The full scope of the Endurance Array was first deployed in April 2015, and we are preparing for our eleventh Endurance Array cruise in April-May 2019. Significant technical improvements have been made across the array based on system performance. Among the many improvements, we have updated sensors (Satlantic ISUS sensors replaced with SUNA) and improved bio-fouling mitigation (UV biofouling protection added to dissolved oxygen optodes). Notable successes on the Endurance Array include observations of seasonal hypoxia events at multiple locations using fixed time series, profilers, and gliders. There are also moored multi-spectral optical attenuation and absorption time series from fixed depths and from profilers. While the OOI data portal is the source of all Endurance Array data, to better serve the regional user community, some Endurance Array data is passed through other widely used access points. Near real-time Endurance buoy meteorological and surface data can be accessed through NDBC. Recent near real-time Endurance Array data can also be accessed through the regional IOOS site, nanoos.org. OOI glider data is also passed on to the IOOS Glider DAC.
[media-caption type="image" path="https://oceanobservatories.org/wp-content/uploads/2019/01/RegionalCabledArray-300x200.jpg" link="#"]Figure 3. The R/V Revelle fully loaded with the Regional Cabled Array infrastructure for installation during Leg 1 of the 2018 expedition. (Photo credit: OOI UW) [/media-caption]The Regional Cabled Array (Figure 3) is now in its 5th year of operation. As part of the OOI 2.0 transition, the UW partnered with Pacific Northwest Gigapop to operate the terrestrial west coast infrastructure, which included moving the Cabled Array and CI servers to Seattle from Portland, Oregon. In addition, the UW is now responsible for the port agent drivers and data parsers for Cabled Array Core and PI instruments. The CI Machine to Machine interface is now being routinely used by the community to access Cabled Array data, and compared to samples for verification. The OOI Cabled Array Core infrastructure is enhanced by the addition of 13 “PI” instruments with funding from the NSF, the Office of Navy Research and Germany. Newly installed PI instruments include two cabled multibeam sonars that are imaging all methane plumes issuing from the seeps at Southern Hydrate Ridge as well as a CTD-O2 sensor, two new geophysical sensors, the cabled COVIS multibeam sonar, as well as three uncabled thermistor arrays. The Shallow Profiler moorings continue to be work horses for the Cabled Array, having completed >30,000 profiles since 2015. During this next ~ six months, the Cabled Array team is working hard on platform and instrument refurbishment, and integration as testing in preparation for our 2019 cruise, which begins late May onboard the R/V Atlantis.
The OOI cyberinfrastructure (CI) is a robust CI system architecture with established processes based on community best practices that allows 24/7 connectivity and ensures sustained, reliable worldwide ocean observing data any time, any place, on any computer or mobile device. Since the operations and maintenance phase of the project started in January 2016, the OOI CI system infrastructure has provided and continues providing extremely high uptime and quality of service, has served over 150 million user requests, delivered over 100TB of data to user from over 100 distinct countries across the globe. This CI architecture is being used as model by other NSF facilities.
Read MoreStrong Variability in Irminger Sea Winter Heat Loss Measured

From Josey et al., 18 December 2018
A recent paper by Josey et al. [1] use data from the OOI Irminger Sea surface mooring to present the first characterization of multi-winter surface heat exchange at a high latitude North Atlantic site based on in-situ measurements. Heat loss in the North Atlantic is a primary determinant of how much deep water is formed in a given winter, which ultimately influences the strength of the Atlantic circulation. The Irminger Sea is a key deep convection site [2], [3], but the amount of heat lost is poorly known because winter measurements are difficult to obtain in the harsh environment [1].
Data from the first four deployments of the Irmginer surface mooring provided early winter observations in three consecutive years – 2014, 2015 and 2016. Strong variations on times scales of days to weeks are apparent in the air-sea flux components. These combine to create net heat losses exceeding 400 W/m^2 on at least one occasion each winter (Fig. 1 d).
The integrated effects of the anomalously strong heat loss events in 2014–2015 result in cumulative net heat loss significantly greater than following years (Fig. 1 e,f) This is primarily due to variations in frequency of intense short timescale (1–3 days) forcing (Fig. 1g) that would be difficult to detect without the mooring observations.
Interpreting the observations in the context of a high-resolution atmospheric model (European Centre for Medium Range Weather Forecasts Reanalysis 5) shows that the main source of multi-winter variability is changes in the frequency of Greenland tip jets that can result in hourly mean heat loss exceeding 800 W/m2 (Fig. 1g). The tip-jet events result from the mountainous Greenland terrain, which focuses winds into narrow, very strong jets over the ocean [4], [5]. Josey et al. [1] suggest how changing atmospheric circulation may influence the number of events and hence the ocean heat loss.
Improved understanding of Irminger Sea winter heat loss is likely to be critical to reliable projections of future changes in both the North Atlantic overturning circulation and climate variability.
[blockquote][1] Josey, S.A., M.F. de Jong, M. Oltmanns, G.K. Moore and R.A. Weller, 2019. Extreme variability in Irminger Sea winter heat loss revealed by ocean observatories initiative mooring and the ERA5 reanalysis, Geophys. Res. Lett., 46. https://doi.org/10.1029/ 2018GL080956
[2] de Jong, M.F. and L. de Steur, 2016. Strong winter cooling over the Irminger Sea in winter 2014–2015, Geophys. Res. Lett., 43, 106–107. https://doi.org/10.1002/2016GL069596
[3] de Jong, M.F., M. Oltmanns, J. Karstensen, and L. de Steur, 2018. Deep convection in the Irminger Sea observed with a dense mooring array. Oceanography, 31(1), 50–59. https://doi.org/10.5670/oceanog.2018.109
[4] Doyle, J.D. and M.A. Shapiro, M. A., 1999. Flow response to large-scale topography: The Greenland tip jet. Tellus A: Dynamic Meteorol. and Oceanog., 51(5), 728–748. https://doi.org/10.3402/tellusa.v51i5.14471
[5] Moore, G. W. K., & Renfrew, I. A. (2005). Tip jets and barrier winds: A QuickSCAT climatology of high wind speed events around Greenland, J. Climate, 18(18), 3713-3725, https://doi.org/10.1175/JCLI3455.1.
[/blockquote] Read More
Unique Offshore Transport of Shelf Water by Subduction Identified
From Zhang and Partida, 15 October 2018
The shelf break front is a persistent feature in the Middle Atlantic Bight, with the foot of the front found near the 100 m isobath. Warm core rings pinched off from the Gulf Stream are found over the continental slope, and have significant impacts on the frontal system when they impinge on the shelf. Zhang and Partida, 2018 use data from OOI Pioneer Array moorings and gliders to document a unique shelf/slope interaction related to the presence of a warm core ring.
Satellite SST imagery shows a well-formed ring impinging on the shelf south of New England during June 2014. Observations from the Pioneer Offshore and Central Offshore moorings are able to identify relatively cold, fresh shelf water that migrates downward with time during the period that ring water is at the surface. Relatively high dissolved oxygen concentration indicates that the shelf water was recently exposed to the surface. This suggests that shelf water filaments are being subducted at the edge of the ring. A cross-shelf section from the Pioneer EB glider (Figure above) clearly shows the cold, fresh shelf water beneath warm, salty ring water. The shelf water is seen well offshore of 100 m where the frontal boundary would be expected in the absence of interaction with the ring.
Computer simulations reproduce the observed phenomenon and reveal the underlying mechanism. The onshore movement of the warm-core ring sharpens the interface between the ring and shelf waters. The subducted flow results from circulation trying to relax the sharpening interface and serves to transport sub mesoscale filaments of shelf water offshore. This offshore flow of subducted shelf water may be a significant exchange mechanism, but has not been well studied. It does not have a surface signature and cannot be seen by satellites.
Read MoreHypoxic Conditions Over the Oregon Shelf Respond to Wind Forcing on Time Scales of Days

From Barth et al., 9 February 2018
In recent years, hypoxic and even anoxic events have regularly occurred off Washington and Oregon as they have in upwelling regions worldwide [1, 2]. The OOI Endurance Array’s location, platforms and sensors were designed to address major OOI Science Themes with a particular focus on Hypoxia on Continental Shelves and Shelf/Slope Exchange [3]. Since its first full deployment in April 2015, the Endurance Array has maintained oxygen sensors at 6 fixed locations near the surface and near the bottom over the Washington and Oregon shelf and slope. Similar oxygen sensors are found on Endurance Array profilers and gliders and across other OOI arrays.
OOI marine operators, systems engineers and data team members have worked together to continually improve the quality of the OOI dissolved oxygen data products. We have worked with the vendor to improve their calibration of sensors; have compared data to physical samples [4]; and have implemented a UV-based biofouling mitigation [5].
Science Highlight: OOI Endurance Array data [6] describe low-oxygen events off central Oregon. Data from July 2017 illustrate variability on time scales of days as the wind-driven upwelling circulation advects low oxygen waters back and forth across the shelf. (Figure 1).
During this time, near-bottom oxygen levels at the OOI Oregon Inshore Surface mooring were often below the hypoxia threshold. When winds blow to the south, the near-bottom temperature decreases due to coastal upwelling, with a slight lag relative to the wind. During these events, near-bottom oxygen usually decreases (e.g., 23-25 July). Conversely, during low or northward winds the near-bottom temperature and oxygen increase rapidly. These changes are consistent with the upwelling circulation drawing near-bottom cold water low in dissolved oxygen toward the coast during upwelling and pushing warm water containing more oxygen down and away from the coast near the bottom during downwelling. The dissolved oxygen does not follow the winds or temperature as clearly as temperature follows the wind because there are the additional biological processes of photosynthesis and microbial decay that raise or lower dissolved oxygen levels, respectively.
Since this report [6], researchers continue to use OOI data to characterize hypoxia in summer 2018. There is also increasing interest in, and use of, OOI data by mission-oriented agencies such as the Oregon Department of Fish and Wildlife.
[blockquote][1] Grantham, B. A., Chan, F., Nielsen, K.J., Fox, D.S., Barth, J.A., Huyer, A., Lubchenco, A., Menge, B.A. (2004). Upwelling-driven nearshore hypoxia signals ecosystem and oceanographic changes in the northeast Pacific. Nature, 429, 749-754. DOI: 10.1038/nature02605.
[2] Chan, F., Barth, J.A., Lubchenco, J., Kirincich, A., Weeks, H., Peterson, W.T., Menge, B.A. (2008). Novel emergence of anoxia in the California Current System. Science, 319, 920, DOI: 10.1126/science.1149016
[3] ORION Executive Steering Committee (2007). Ocean Observatories Initiative Scientific Objectives and Network Design: A Closer Look. Joint Oceanographic Institutions, Inc. Washington, DC.
[4] Holm, C., R.T. Rohrer, E.P. Dever, and J.P. Fram (2018) Quality Assessment of Moored Near Surface Instrument Time Series on the OOI Endurance Array, Abstract IS14A-2541 presented at 2018 Ocean Sciences Meeting, Portland, OR, 12-16 Feb.
[5] Wingard, C.E., R.A. Desiderio, J.P. Fram, and E.P. Dever (2018) Time Series Measurements of Inherent and Apparent Optical Properties from the OOI Endurance Array, Abstract IS14A-2543 presented at 2018 Ocean Sciences Meeting, Portland, OR, 12-16 Feb.
[6] Barth, J. A., J. Fram, E. P. Dever, C. Risien, C. Wingard, R. W. Collier, and T. D. Kearney, 2018. Warm blobs, low-oxygen events and an eclipse: The Ocean Observatories Initiative Endurance Array captures them all, Oceanography 31(1): 90-97, https://doi.org/10.5670/oceanog.2018.114.
[/blockquote] Read More