
News
OOI Biogeochemical Sensor Data Best Practices and User Guide: Open Community Review
The Ocean Observatories Initiative (OOI) Biogeochemical (BGC) Sensor Data Best Practices and User Guide is the result of an NSF-funded (OCE2033919) grass-roots community effort to broaden the use of OOI biogeochemical sensor data and increase community capacity to produce analysis-ready data products. The guide includes five chapters: The Introduction (Chapter 1) provides information on the OOI program, including data access, processing, and recommended end user QA/QC relevant to all OOI biogeochemical sensors, and Chapters 2-5 cover the following groups of BGC variables and associated sensors: Dissolved oxygen, nitrate, carbonate chemistry, and bio-optics.
This effort brought together an international group of 39 ocean observing experts, across all career stages, from 19 institutions and 5 countries, each of whom brings expertise on biogeochemical sensors, data analysis and ocean observing infrastructure, as well as research expertise in ocean biogeochemistry. The initial OOI Biogeochemical Sensor Data (OOI BGC) Working Group was formed in July 2021 through an open application process. A three-day virtual meeting in July 2021 launched the Working Group, with consensus-building activities to develop the scope and structure of the Best Practices and User Guide. From July 2021 to June 2022, the Working Group drafted a beta version of the Best Practices and User Guide that went through two rounds of internal review within the Working Group. A draft version of this document was Beta Tested by 14 current and prospective OOI BGC data users, who joined the Working Group members for a 3-day workshop in June 2022 to provide feedback that has since been used in revising and finalizing the document.
The OOI Biogeochemical Sensor Data Best Practices and User Guide is now complete, and has been submitted to the Ocean Best Practices System (OBPS). As a next step, we are seeking to gain GOOS endorsement of the document. In order to do so, the guide must undergo a rigorous community review process whereby comments are publicly invited and adjudicated. We now invite community members to review the guide and submit comments by February 28, 2023. After completing the open review, we will revise the document based on the reviewers’ comments and upload an updated, final version to OBPS.
We encourage feedback from everyone, including both disciplinary experts and users new to each of these sensor types, as well as both experienced and new users of OOI data. Reviewers are welcome to provide feedback on the entire document, or on chapters or sections that are of particular relevance to their interests or expertise.
How to review the OOI BGC Sensor Data Best Practices and User Guide
We are aiming for a transparent and open community review process, and as such, all reviewer comments and responses to them will be public. We invite reviewers to provide feedback on the OOI Biogeochemical Sensor Data Best Practices and User Guide via two different pathways:
- Reviewers may comment directly into a Google Doc version of the guide in the form of comments added to the text. This will be most useful for comments or to suggest revisions on specific sections of the text. We request that reviewers sign in via Google or include their name and email in their comments so that we can identify and, if needed, follow up with individuals providing reviews.
- Reviewers may submit lengthier and/or more overarching comments via an online form. All submissions to this form can be viewed here.
OOI at AGU 2022
[media-caption path="/wp-content/uploads/2020/10/agufront2-scaled-e1603490292321.jpeg" link="#"]OOI will be very much present in person at the AGU Fall Meeting 2022. Come visit us at the OOI booth #1321 in the exhibit hall and mark your calendar for the sessions below. [/media-caption]
This year, OOI will be in person at the AGU Fall Meeting 2022 in Chicago from December 12-16. We will have a booth (#1321) in the exhibit hall and will be in person to present sessions and posters. The following is a compilation of OOI-related presentations at this year’s fall meeting. If we’ve missed any OOI-related sessions, please contact dtrewcrist@whoi.edu and we will be happy to add them. Hope to see you in person this year! Share your AGU news at #AGU22.
Monday, 12 December 2022
08:00 – 09:00 CST(09:00 – 10:00 EST) Online Only
V11B-02 Detecting the syn- and after-eruption process of the Axial Seamount with ambient noise interferometry
Chao J Lee, Nanjing University, Nanjing, China and Youyi Ruan, Brown University, Providence, United States
09:00 – 12:30 CST (10:00 – 13:30 EST) McCormick Place – Poster Hall, Hall – A
V12B-0045 Developing a Catalog of Automated Focal Mechanisms for Microearthquakes at Axial Seamount Based on Waveform Correlation
Maochuan Zhang1, William S D Wilcock1, Felix Waldhauser2, Kaiwen Wang2, David Paul Schaff2, Maya Tolstoy1 , and Yen Joe Tan3, (1)University of Washington, School of Oceanography, Seattle, WA, United States, (2)Lamont-Doherty Earth Observatory, Columbia University, Palisades, NY, United States, (3)Chinese University of Hong Kong, Earth system science, Hong Kong, China
09:16-09:23 CST (10:16-10:23 EST) McCormick Place – N426c
ED12A-03 Accessible Oceans: Exploring Ocean Data Through Sound
Amy S Bower, Woods Hole Oceanographic Institution, Woods Hole, MA, United States, Jon Bellona, University of Oregon, School of Music and Dance, Eugene, OR, United States, Jessica Roberts, Georgia Institute of Technology, College of Computing, Atlanta, GA, United States, and Leslie Smith, Your Ocean Consulting, Knoxville, TN, United States
09:43-09:53 CST (10:43-10:53 EST) McCormick Place – S103cd
S12C-05 Listening to Fin Whales with Distributed Acoustic Sensing: A Study in Opportunistic Acoustics
Agatha Podrasky, David Podrasky, Megan Everingham, Noah Clayton, and Thomas Coleman, Silixa LLC, Missoula, MS, United States
15:00-18:00 CST Exhibit Hall – Visit OOI’s Booth #1321
18:30-19:30 CST (19:30-20:30 EST) McCormick Place – S106a Note: Attendance at this event can be either in person or virtual.
TH15B Ocean Observatories Initiative Facility Board (OOIFB) Town Hall
Annette M DeSilva, University of Rhode Island, Graduate School of Oceanography, Narragansett, RI, United States and Kendra L Daly, University of South Florida, College of Marine Science, St. Petersburg, FL, United States
Tuesday, 13 December 2022
08:00 – 09:00 CST (09:00 – 10:00 EST) Online Only
OS21B-09 Centimeter-Scale Mapping of Four Hydrothermal Vent Sites at Axial Seamount: Low-Altitude Surveys Combining Multibeam Sonar, Lidar, and Color Stereo Photography
Jennifer Brophy Paduan1, David W Caress1, Eric J Martin1, Michael Risi1, Chad D Kecy1, Giancarlo Troni2 , and David A Clague1, (1)Monterey Bay Aquarium Research Institute, Moss Landing, CA, United States, (2)Monterey Bay Aquarium Research Institute, Watsonville, CA, United States
10:00-18:00 CST Exhibit Hall – Visit OOI’s Booth #1321
14:45 – 18:15 CST (15:45 – 19:15 EST) McCormick Place – Poster Hall, Hall – A
OS25E Process Studies, Educational Activities, and Technological Advancements Using Data and Infrastructure from the Ocean Observatories Initiative (OOI)
James B Edson1, Edward Paul Dever2, Deborah S Kelley3, Albert J Plueddemann1 and Anthony Koppers2, (1)Woods Hole Oceanographic Institution, Woods Hole, MA, United States(2)Oregon State University, College of Earth, Ocean, and Atmospheric Sciences, Corvallis, OR, United States(3)University of Washington Seattle Campus, School of Oceanography, Seattle, WA, United States
OS25E-0961 Overview of ambient noise research and outreach with OOI hydrophones
John Ragland, University of Washington Seattle, Seattle, WA, United States, Felix Schwock, University of Washington Seattle Campus, Electrical Engineering, Seattle, WA, United States, Zhaoyu Liu, University of Washington Seattle Campus, Human Centered Design and Engineering, Seattle, WA, United States, and Shima Abadi, University of Washington, School of Oceanography, Seattle, WA, United States
OS25E-0962 Multiyear ocean sound levels at the Northeast Pacific OOI Sites and Beaufort-Sea Arctic recorded using calibrated moored hydrophones
Robert P Dziak1, Samara Haver2, Haru Matsumoto3, Lauren Roche3, Jason Gedamke4, Meghan F Cronin1, Phyllis J Stabeno1 , and William W. Chadwick Jr5, (1)NOAA Pacific Marine Environmental Laboratory, Seattle, WA, United States, (2)NOAA/OSU Cooperative Institute for Marine Resources Studies, Newport, OR, United States, (3)Oregon State University, CIMRS, Newport, OR, United States, (4)NOAA Fisheries, Office of Science and Technology, Silver Spring, MD, United States, (5)CIMERS, Newport, OR United States
OS25E-0963 Neural Implicit Compact Representation to Compress Distributed Acoustic Sensing Data
Yiyu Ni1, Shaowu Pan2, Nathan Kutz2, Bradley Paul Lipovsky1 , and Marine Denolle1, (1)University of Washington, Department of Earth and Space Sciences, Seattle, WA, United States, (2)University of Washington, Department of Applied Mathematics, Seattle, WA, United States
OS25E-0964 Multi-Year Study on the Impacts of Assimilating OOI Glider Data on Cross-Shelf Vertical Structure in the Northeast Pacific Ocean
Caitlin Amos, US Naval Research Laboratory Post-Doctoral Scholar, Washington, DC, United States, John J Osborne, US Naval Research Laboratory, Ocean Dynamics and Prediction, Stennis Space Center, MS, United States, and Gregg Arthur Jacobs, US Naval Research Laboratory, Ocean Sciences Division, Stennis Space Center, MS, United States
OS25E-0965 Columbia River Plume Variability in Summer 2022
Edward Paul Dever1, Craig M Risien1, Christopher E Wingard1, Jonathan P Fram1, Parker MacCready2, Piero F Mazzini3, Stuart Pearce1, and Jonathan Whitefield1, (1)Oregon State University, College of Earth, Ocean, and Atmospheric Sciences, Corvallis, OR, United States, (2)University of Washington, Olympia, WA, United States, (3)Virginia Institute of Marine Science, Gloucester Point, VA, United States
OS25E-0966 Analysis of AC-S (Spectrophotometer) Proxies for Ecosystem Variables using the OOI Endurance Array off the Coasts of Oregon and Washington
Nicholas Romero, California State University Monterey Bay, Marine Science, Seaside, CA, United States, Christopher E Wingard and Edward Paul Dever, Oregon State University, College of Earth, Ocean, and Atmospheric Sciences, Corvallis, OR, United States
OS25E-0967 Seasonal to interannual variability of salinity on the Northeast U.S. continental shelf
Svenja Ryan, Caroline Ummenhofer, and Glen Gawarkiewicz, Woods Hole Oceanographic Institution, Woods Hole, MA, United States
OS25E-0968 Relocation of the OOI Pioneer Array
Albert J Plueddemann, Woods Hole Oceanographic Institution, Woods Hole, MA, United States and Derek Buffitt, Woods Hole Oceanographic Institution, Applied Ocean Physics and Engineering, Woods Hole, MA, United States
OS25E-0969 Improvements to the COARE Bulk Flux Algorithm using OOI Surface Flux Data
James B Edson1, Douglas C Vandemark2, Hyodae Seo1, Marc Emond2, Cesar Sauvage1 , and Carol Anne Clayson1, (1)Woods Hole Oceanographic Institution, Woods Hole, MA, United States, (2)University of New Hampshire Main Campus, Durham, NH, United States
OS25E-0970 The Application and Quantification of Systems Engineering Techniques as Applied to the Ocean Observatories Initiative
Matthew Palanza and Paul Matthias, Woods Hole Oceanographic Institution, Applied Ocean Physics and Engineering, Woods Hole, MA, United States
Wednesday, 14 December 2022
10:00-18:00 CST Exhibit Hall – Visit OOI’s Booth #1321
16:15-16:45 CST Exhibit Hall – OOI’s Booth #1321
Q & A about the Relocation of the Coastal Pioneer Array to the Southern Mid-Atlantic Bight. OOI Coastal and Global Scale Nodes Principal Investigator Al Plueddemann will be on hand to answer your questions about plans and progress on the relocation of the Pioneer Array.
Thursday, 15 December 2022
10:00-18:00 CST Exhibit Hall – Visit OOI’s Booth #1321
Friday, 16 December 2022
09:00 – 12:30 CST (10:00 – 13:30 EST) McCormick Place – Poster Hall, Hall – A
S52C-0077 Unraveling the Distribution of Microseism Sources with Submarine Distributed Acoustic Sensing
Jiaqi Fang1, Ethan Williams2, Yan Yang2, Ettore Biondi2 , and Zhongwen Zhan2, (1)California Institute of Technology, Pasadena, CA, United States, (2)California Institute of Technology, Seismological Laboratory, Pasadena, CA United States
10:00-13:00 CST Exhibit Hall – Visit OOI’s Booth #1321
Read MoreRCA and ROPOS: A Long-Term International Collaboration
A Canadian and American team worked side-by-side for 45 days in August in the NE Pacific Ocean during the eighth operations and maintenance expedition for OOI’s Regional Cabled Array (RCA). The team used the Canadian remotely operated vehicle (ROV) ROPOS to conduct maintenance operations on RCA’s underwater cabled observatory spanning the Juan de Fuca Plate and at water depths from 80 m to 2900 m. Intense operations included the recovery and reinstallation of 222 instruments and a 2700 m-tall, two-legged Shallow Profiler Mooring. This expedition took place on the global class research ship the R/V Thomas G. Thompson, operated by the University of Washington (UW). Twenty-six students joined the cruise as part of the UW at-sea experiential learning program called VISIONS.
ROPOS is operated by the Canadian Scientific Submersible Facility (CSSF). The vehicle was specially designed for cabled observatory work, bringing in components from the oil and gas field, and a uniquely designed Remotely Operated Cable Laying system (ROCLS) that allows the vehicle to install extension cables extending for several kilometers on the seafloor. Their work culminated in 2014 during an 83-day cruise onboard the R/V Thompson, which resulted in the installation of >15,000 m of extension cables (in total, ~33,000 m of extension cables was installed on the seafloor), >140 instruments, and platforms on the six-state of-the art moorings with instrumented profiling vehicles. They also installed 18 junction boxes at the key experimental sites using their underbelly latching system that allows the vehicle to directly secure loads up to 4,000 lbs beneath the vehicle. This latching system was adopted by the Deep Submergence Facility ROV Jason, which has conducted multiple RCA maintenance cruises.
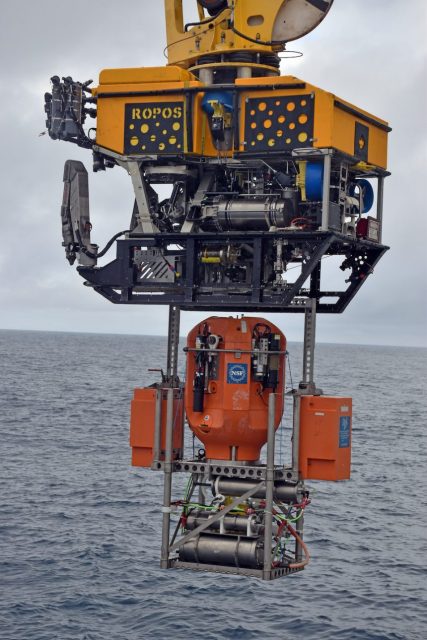
[media-caption path="/wp-content/uploads/2022/12/R2209_20220812_091705_launch_ME.Axial-Base_Science-Pod_install-2.jpg" link="#"]The Shallow Profiler Science Pod being deployed with ROPOS during Leg 1 of the RCA 22 cruise at Axial Base. Credit: M. Elend, University of Washington, V22.[/media-caption]
During this latest expedition, ROPOS conducted 60 dives over 33 at-sea days. Keith Tamburri led seven members of the ROPOS team, who worked 12 hours on, 12 hours off for 45 days. Operations are more similar to industry with as little time on deck as possible for the ROV, typically about three hrs before ROPOS reentered the water. Team work is exemplified during ROPOS operations where two pilots each operate a manipulator to conduct complex operations. The ROPOS team was joined in the dive control laboratory by varying members of the RCA’s team, who directed ROPOS activities on the seafloor and throughout the water column, and the VISIONS’22 students who stood 4 hour watches. (A list of ROPOS and RCA team members can be found here).
During this 8th RCA recovery and deployment expedition, the R/V Thompson traveled to all of the RCA sites. ROPOS recovered and redeployed a diverse array of instruments and four small seafloor substations that provide power and communications to instruments on the seafloor and to the instrumented Deep and Shallow profiler moorings. The ROV also was used to install a 500 m long extension cable that allowed bringing the Southern Hydrate Ridge live again. ROPOS also recovered equipment and samples for externally funded principal investigators, including several novel instruments developed by scientists in the US and Germany. ROPOS tasks were many and varied. The vehicle emplaced packages up to 3200 lbs in weight and the pilots skillfully used the manipulators to do everything from scrubbing biofouling off cables to unplugging and plugging in instruments to the seafloor cable
In addition to RCA operations, ROPOS was used to help advance scientific investigations involving instruments added onto the RCA cabled network. For example, as part of an Early Career award to for Dr. Rika Anderson at Carleton College, ROPOS conducted sampling dives using a Universal Fluid Obtainer on the ROPOS porch to sample fluids for follow-on analyses of microbes and viruses. Through another NSF award to Dr. Wilcock and his UW colleague Dana Manalang, ROPOS installed a first of its kind acoustic network on the western and eastern rim of Axial Seamount and within its caldera to examine deformation within the caldera. A suite of CTD instruments were also turned within the caldera to test the hypothesis that brines are emitted from the subsurface associated with submarine eruptions as part of and NSF award to Dr. William Chadwick at the Oregon State University. Lastly, ROPOS inspected a Quantification sonar and recovered an Overview Sonar on Southern Hydrate Ridge as part of a project funded by the German Federal Ministry of Education and Research to MARUM at the University of Bremen, led by investigators Gerhard Bohrmann and Yann Macron. In addition, their 4K high-definition camera was cleaned and a CTD turned. The sonar and camera instruments are another example of an international collaboration.
“Our ROPOS team really enjoys working with the team from the University of Washington, School of Oceanography and Applied Physics Laboratory, who are responsible for the RCA. They are a professional, well-organized, efficient, friendly, and mutually respectful group, which makes these long missions at sea productive, efficient, and successful,” said Keith Shepherd, General Manager, Canadian Scientific Submersible Facility. “And for this cruise, in particular, it was a real pleasure working along with UW undergraduates onboard as part of UW’s at-sea experiential program VISIONS. The students brought a curiosity, enthusiasm, and energy that were always welcome during the long hours in the dive control van.”
Added Kelley, “It really takes a tremendous amount of time, effort, and teamwork to pull off an expedition of this length and complexity. We are grateful to have had the opportunity to work again with our Canadian colleagues. It was an excellent international collaboration to help maintain and expand the capabilities of the RCA. “ Because of the complex nature of the undersea work required to keep the RCA operational, few facilities are trained and equipped to execute such operations.
[media-caption path="/wp-content/uploads/2022/12/ROPOS-ROCLS_IEEE-copy-2.jpg" link="#"]ROPOS with the cable laying system ROCLS attached during the 2014 deployments of the extension cables. Credit: M. Elend, University of Washington, V14.[/media-caption]
Read More
Video Demo about Using QARTOD Flags for OOI data
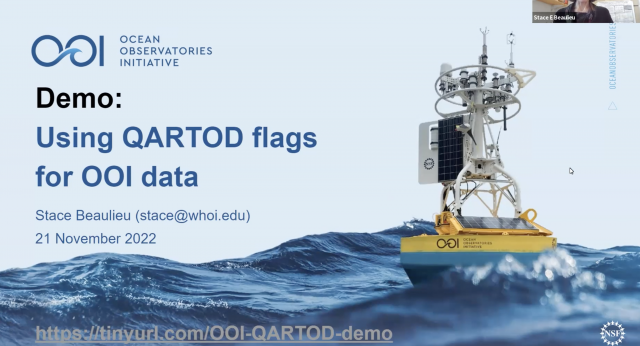
Woods Hole Oceanographic Senior Research Specialist Stace Beaulieu presents a demonstration on how to explore and visualize data for the Ocean Observatories Initiative (OOI) in Data Explorer, with an emphasis on Quality Assurance of Real-Time Oceanographic Data (QARTOD) flags. In this example, we use QARTOD flags in Data Explorer to rapidly identify a time period of interest and then access those data from ERDDAP.
https://vimeo.com/user110037220/qartod
Read MoreNature Review Paper Reveals New Understandings of Mid-Ocean Ridge Systems
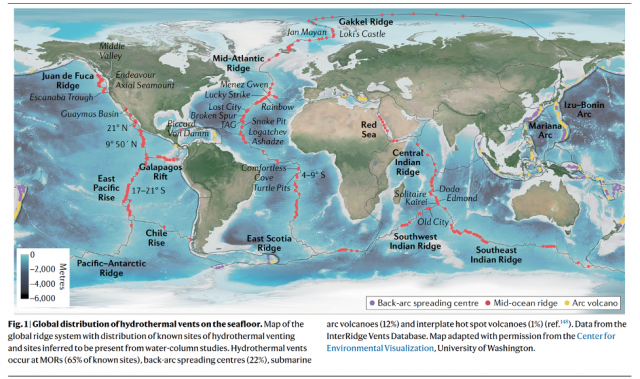
Only a small percentage of the global seafloor has been investigated, leaving the deep ocean as one of the last frontiers to be explored and sampled. Mid-ocean ridges (MOR) systems extend about 60,000 kilometers around the globe, are where 70% of the volcanism on Earth occurs, and are dynamic and active tectonic regions.
A recent Nature Review paper, Früh-Green, et al. 2022, written by a multi-disciplinary team of experts summarizes what is known about MORs, their importance in regulating seawater chemistry and global chemical fluxes, and the diverse ecosystems that they support in the absence of light and under extreme conditions. The authors describe the tectonic, magmatic, and hydrothermal processes that govern how they form and change and describe some of the biogeochemical cycles at varying spreading rates.
“The first hydrothermal vent was discovered in 1977, which was followed by myriad discoveries about these amazing deep-sea environments over the next 45 years,” said OOI’s Regional Cabled Array Principal Investigator, Deborah Kelley at the University of Washington and an author of the paper. “Yet, much remains to be understood about these environments, which play a key role in regulating seawater chemistry and global chemical fluxes. Key unknowns include the evolution of the novel microbial communities that they host and the diversity of viruses. This paper summarizes some of the key discoveries that researchers have made and questions that remain to be answered.”
Among the paper’s key findings are:
- Spreading rates control variations in heat sources, magma input, and tectonic processes along MORs, providing multi-faceted habitats for life.
- Seawater circulation and hydrothermal alteration regulate seawater chemistry and change the composition and physical properties of the lithosphere (crust and upper mantle).
- Roughly 50-60% percent of global MORs are spreading at slow to ultraslow rates resulting in the exposure of lower crustal and upper mantle rocks. This spreading is creating asymmetric ridge segments that support different structures, hydrothermal processes, and vent fluid chemistry.
- Serpentinization decreases density and seismic velocities of mantle rocks, weakening the oceanic lithosphere along faults. Serpentinization also produces hydrogen and organic molecules that provide energy for microbial life.
- Unlike serpentinizing systems, basalt-hosted systems support a vast, hot and diverse microbial biosphere. Advanced technologies are allowing better characterization of the genetic makeup and metabolism of microbes and the role of viruses in shaping biodiversity.
- Hydrothermal processes govern global chemical fluxes of magnesium, iron, manganese, and other volatiles and provide nutrients to the deep ocean. Microbial interactions and oxidation of organic compounds within hydrothermal plumes produce organic carbon.
[media-caption path="/wp-content/uploads/2022/11/Screen-Shot-2022-11-29-at-10.54.32-AM.png" link="#"]Global distribution of hydrothermal vents on the seafloor. Map of the global ridge system with distribution of known sites of hydrothermal venting and sites inferred to be present from water-column studies. Hydrothermal vents occur at MORs (65% of known sites), back-arc spreading centers (22%), submarine arc volcanoes (12%) and interplate hot spot volcanoes (1%). Data from the InterRidge Vents Database. Map adapted with permission from the Center for Environmental Visualization, University of Washington.[/media-caption]
“Ocean observatories like OOI’s Regional Cabled Array and Ocean Networks Canada , are providing researchers unprecedented real-time views into these highly dynamic regions that help form the face of our planet,” added Kelley. “RCA has allowed researchers to measure and monitor activity at the magmatically robust Axial Seamount, on the Juan de Fuca MOR for example, providing insights into when it might next erupt. Such underwater observatories will only continue to advance our knowledge as we expand capabilities to observe, monitor, and sample seafloor environments and the overlying water column in real time with more sophisticated sensors and advanced underwater vehicles and robotic technologies.”
Reference:
Früh-Green, G.L., Kelley, D.S., Lilley, M.D. et al. Diversity of magmatism, hydrothermal processes and microbial interactions at mid-ocean ridges. Nat Rev Earth Environ (2022). https://doi.org/10.1038/s43017-022-00364-y
Read More
Improving Reliability and Availability of Dissolved Oxygen Glider Data
OOI’s Coastal Endurance Array Team is making great strides in ensuring the accuracy of glider dissolved oxygen measurements and making these data readily available to researchers. The team has compared glider oxygen data with independent transects and climatologies compiled by west coast colleagues. They are increasing the number of in situ comparisons of glider oxygen data with bottle samples taken in proximity to the gliders. They have built a benchtop system to do two-point calibrations for oxygen sensors to help ensure their accuracy when the gliders are in the water. And, working with OOI colleagues at WHOI, the team is helping to design and test improved sensor mounts to perform in situ air calibrations of glider oxygen measurements.
“A couple of years ago, Endurance Glider Lead Stuart Pearce developed code to put all of the oxygen data collected by our glider fleet into the DAC, the national central database for glider data,” said Ed Dever, Principal Investigator of the Coastal Endurance Array and Professor at Oregon State University. “Prior to doing this, Stuart examined the data and metadata for any gross errors and issues. That was the first of many steps we have taken to ensure OOI oxygen data are reliable and available so they can be trusted and used by researchers. Our effort is paying off. The glider data available on the DAC are identical to that now available on OOI’s Data Explorer. Endurance glider lines off Newport, OR and Grays Harbor, WA will be the backbone for the northern Californian Current part of the nascent Boundary Ocean Observing Network. The OOI glider lines map seasonal development of hypoxic areas off Oregon and Washington from the coast to the edge of the continental shelf.”
[media-caption path="/wp-content/uploads/2022/11/glider.png" link="#"]More than 137 glider missions have occurred along the Newport and Grays Harbor lines since 2014. Credit: Coastal Endurance Array at OSU.[/media-caption]
Collaborations
Enough oxygen data has been collected and shared in the northeast Pacific that is now possible to make high resolution regional climatologies of temperature, salinity and oxygen. Risien et al. (2022) compiled ~20 years of data taken by Jennifer Fisher (NOAA) and many others, to develop analysis ready transects of water property data off Newport, Oregon. These datasets include both climatologies and individual interpolated, quality-controlled, transect data. The Endurance Team compared glider dissolved oxygen with shipboard CTD samples collected by Fisher along the Newport transect in July 2021. Oxygen measurements from the gliders and CTDs samples compared well and provided confidence that glider and shipboard transects can map hypoxic conditions at comparable resolution and accuracy. Added Dever, “We were able to do a side-by-side comparison of the temperature, salinity, and oxygen data collected by the gliders over our Newport hydrographic line with the CTD data sampled by the Fisher’s team using the R/V Elakha. The comparison was quite good and served to validate the quality of the glider data that are an integral part of the Endurance Array.”
Engineering Solutions
A couple years ago, team member Jonathan Whitefield worked with Scripps Institution for Oceanography to build an oxygen Winkler titration rig so the team can titrate its own oxygen samples. The system can be used both in the lab and onboard to validate glider and moored oxygen data. The titration rig has been used to increase the number bottle samples taken during glider deployments and recoveries and to reduce the time between sample acquisition and analysis.
Building on this, Whitefield and others recently assembled in-house two-point calibration baths for pre- and post deployment of oxygen data collected by gliders and moorings. Calibrations are performed at anoxic and near-saturated conditions. The two-point calibration system is based on a similar one used at Scripps Institution for Oceanography (López-García, P., et al., 2022). A sodium sulfite solution is injected into bottle samples to get the low endpoint oxygen calibration point. The high endpoint oxygen calibration point is achieved using a stirred bath at 10°C to get to near saturation. The high endpoint oxygen is measured with replicate Winkler titrations. The calibration baths better ensure accuracy by making it possible to perform routine in-house checks of vendor calibrations on glider and moored sensors as well as identify calibration drift after deployment.
What’s ahead
Oxygen data are reviewed weekly by operators and annotated. Real-time automated quality control using QARTOD tests is in development. In-situ air calibration tests of oxygen optodes are planned for spring 2023. At the suggestion of outside investigators, OOI’s Coastal and Global Scale Node team at Woods Hole Oceanographic Institution modified Slocum glider optode mounts to allow in-situ air calibrations of dissolved oxygen on the Irminger Sea and Pioneer Arrays. The mount, however, affected the flow around gliders with radome fins and caused navigation problems. Modeling done at WHOI showed these problems may be due to vortices of the optode on the starboard side of the fin. The Endurance gliders will test a new mount placement during its upcoming bi-annual operations and maintenance cruise in March of 2023.
“We’re part of the community of practice for glider oxygen calibration and validation,” said Dever. “We engage with colleagues, adopt standard practices and widely share data. This community of users will help all of us get a better handle on ongoing changes in our ocean regions.”
References
Risien et al. (2022) Spatially gridded cross-shelf hydrographic sections and monthly climatologies from shipboard survey data collected along the Newport Hydrographic Line, 1997–2021, https://doi.org/10.1016/j.dib.2022.107922
López-García, et al. (2022) Ocean Gliders Oxygen SOP, Version 1.0.0. Ocean Gliders, 55pp. DOI: http://dx.doi.org/10.25607/OBP-1756. (GitHub Repository, Ocean Gliders Oxygen SOP.
Read More
Mission Accomplished: Nine Years of Ocean Data in Support of Solid Science
In November 2022 the Woods Hole Oceanographic Institution’s (WHOI) R/V Neil Armstrong made its final voyage off Cape Cod to the location of the Pioneer Array, marking the end of nearly a decade of data collection as part of the National Science Foundation’s (NSF) Ocean Observatories Initiative (OOI). The mission of this cruise, Pioneer 19, was to perform the final recovery of all ten instrumented moorings and four gliders that had been collecting multidisciplinary ocean and atmospheric measurements since Pioneer 1 was first deployed in 2013. Over the course of nine years, the array, weighing in at nearly 60 tons, was recovered and redeployed twice per year for a total of 18 times, while it collected and transmitted measurements from hundreds of instruments back to shore and over the internet without interruption.
[media-caption path="/wp-content/uploads/2022/11/DSC_0901.jpg" link="#"]The Pioneer 19 Science Party marks the occasion of the first deployment of the Central Surface Mooring that launched the Coastal Pioneer Array on November 21, 2013. The team had their photo taken aboard the R/V Neil Armstrong at the exact time (1:16 pm) when the very first mooring was in place. Credit: Rebecca Travis © WHOI.[/media-caption]
The Pioneer Array was conceived as part of the OOI, which represents a paradigm shift in oceanography. Unlike traditional oceangoing research cruises that may last for a few weeks and are often focused on a particular topic by a specific research group, multidisciplinary data from the OOI arrays are provided in near real-time 24 hours a day, 365 days per year to anyone with an internet connection, for an expected duration of 30 years. The OOI originally consisted of seven arrays in the North and South Atlantic, strategically deployed in water depths ranging from 25 to several thousand meters, to collect measurements related to ocean processes that impact life on the planet. Scientists, educators, and laypersons have taken full advantage of these data since the first of OOI’s array went into the water.
Charting a Trail-Blazing Path
To meet the need for reliable operations of uncrewed cabled and uncabled observatory platforms deployed to the world’s oceans for 30 years, the OOI adopted and tailored formal systems engineering processes established for mission critical systems by government organizations such as NASA and the Department of Defense. These processes included the establishment of science objectives for the OOI that were used to develop engineering requirements. The engineering requirements were decomposed to atomic, testable, “level four” requirements used to create preliminary and detailed software, mechanical, and electrical designs for the OOI infrastructure. While OOI leveraged technology from existing state-of-the-art ocean observing systems, some of the new requirements adopted by OOI included year-long deployments of moorings and gliders in some of the harshest locations in the global oceans. Some of the challenges included instrumenting active seafloor volcanic regions via cables that extend for hundreds of miles across the seabed, telemetering measurements from more than 900 instruments on the seabed, buoys, and free-swimming vehicles to shore via satellite for posting to the internet in near real-time, and piloting a glider fleet that is second in size to the US Navy around the clock.
Pioneer 1 departed on 20 November 2013 from the WHOI dock aboard the RV Knorr, a storied academic research vessel responsible for supporting some of the most significant ocean discoveries of the past century. The mission of Pioneer 1 was to deploy one surface mooring and two profiler moorings during seven days of operation on site. With a 14-person science party aboard, the Knorr steamed to the predetermined site for the “Central Surface Mooring” of the Pioneer Array and completed the deployment of the first mooring by 1:16 PM on 21 November 2013. Later Pioneer cruises would fully populate the array by increasing the number of deployed moorings to include three Surface Moorings, each weighing nine tons, and five Profiler Moorings, at six tons each, plus up to six free-swimming gliders.
Since 2013, the Pioneer Array has steadfastly done its job, collecting, and telemetering measurements to shore, which have been used in tens of science studies leading to new understandings about coastal processes and the health of the planet. The journey does not end with the completion of Pioneer 19. The Pioneer Array will be refurbished and adapted to meet new requirements associated with its next deployment site off North Carolina, with its first deployment scheduled for spring 2024. The wealth of data collected off the New England Shelf will remain available online and continue to be used to answer scientific questions about this region for years to come.
Written by Paul K. Matthias, Senior Program Manager for the OOI.
Read More
Edson Discusses Ocean Observing at Global Level
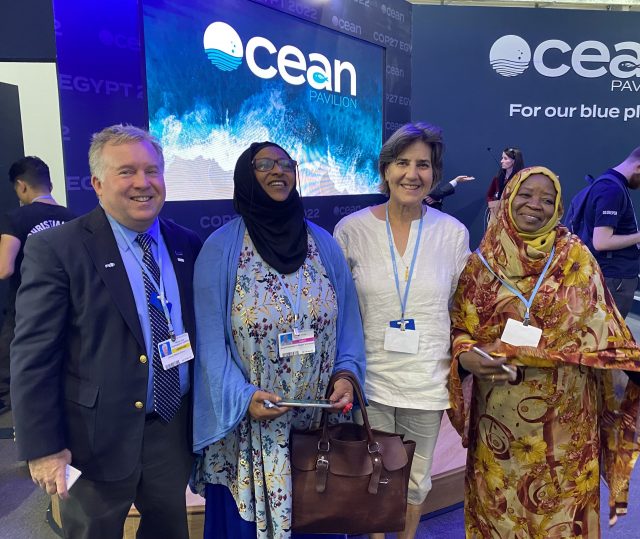
Ocean Observatories Initiative (OOI) Principal Investigator James Edson spent the past week discussing global ocean observing needs at the 27th session of the Conference of the Parties (COP 27). COP27 drew leaders from around the world who came together to develop strategies for minimizing and managing climate change. Edson was invited to travel to Sharm El-Sheikh in Egypt to represent both Woods Hole Oceanographic Institution (WHOI) and OOI at the first-ever Ocean Pavilion at COP27.
Edson was a panelist for three sessions at COP27. The first brought together leaders of ocean observing systems to figure out a way to build a local to global ocean observing system to mitigate and adapt to climate change. This panel was organized by Partnership for Observations of the Global Ocean (POGO). The second, organized by the UK’s National Oceanography Centre, looked at “blue carbon” and the role the ocean can and might play in the uptake and storage of carbon in the marine system. Lastly, Edson addressed opportunities that the blue economy, or marine-related commerce, might facilitate sustainable development and to identify where investment is needed in research, skills, and innovation. The panel was organized by Egypt’s National Institute of Oceanography and Fisheries and Edson described his experience with offshore wind energy and it potential for job training and growth.
[media-caption path="/wp-content/uploads/2022/11/IMG_3778-scaled.jpg" link="#"]During COP27, OOI PI Jim Edson shared his expertise on three panels, one of which focused on how the blue economy might be harnessed for sustainable development. Credit: Ken Kostel ©WHOI.[/media-caption]
The Ocean Pavilion was jointly organized by WHOI and the Scripps Institution of Oceanography, and supported by 15 additional oceanographic research institutions from around the world, serving as partners in the Pavilion. The Ocean Pavilion was a buzz with conversations from morning to evening each day. When not sharing his expertise in panel discussions, Edson spent his time at the Pavilion networking with scientists, educators, students, dignitaries, bankers and industry representatives who stopped by to learn more about the ocean’s role in climate regulation.
“This is exactly the type of place OOI needs to be so that our data are visible and accessible to researchers the world over,” said Edson. “The idea behind the Ocean Pavilion was to bring needed attention to the role of the ocean in regulating climate and how much the ocean is changing in response to ongoing changes. It was important that OOI had a presence there because our data are needed to determine what’s happening in the ocean. This is perfectly aligned with our mission to encourage use of our data to advance understanding. I hope the contacts we made at COP27 will lead to a continued and expanded use of OOI data at a global level.”
[media-caption path="/wp-content/uploads/2022/11/IMG_3660-2-COP1-2-scaled.jpg" link="#"]OOI PI Jim Edson presenting at COP27 about how and types of data are collected by OOI and how scientists are using those data to better understand the changing ocean. Credit: Ken Kostel ©WHOI.[/media-caption]
Read More
Students’ Mini-Boat and Drifter Launched from R/V Neil Armstrong
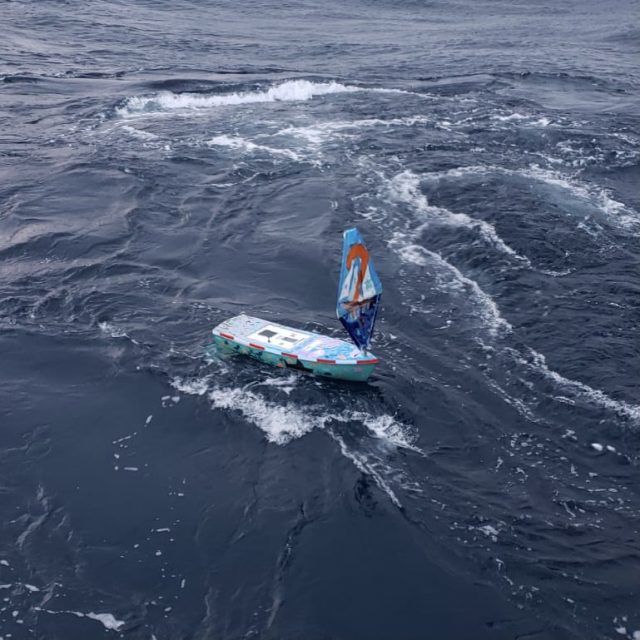
On Sunday November 13, 2022, the Pioneer 19 Team and crew of the R/V Neil Armstrong switched gears from their Pioneer recovery operations to launch a mini-boat and a drifter. Both were constructed by high school students from Waterford, CT, with the help of fourth grade Waterford students, who decorated its sails and hull. The boat is part of the Educational Passages program run by Cassie Stymiest in which the Connecticut high school students participate. The drifter is part of the Student Drifters program developed by the National Oceanic Atmospheric Association (NOAA) and now administered by the Gulf of Maine Lobster Foundation.
The boat, named Lady Lance, contains art inside and messages focused on climate hope and ocean optimism. The students will track the boat’s progress across the Atlantic, as well as the drifter, with the help of James Manning, a retired NOAA employee. Students in Michael O’Connor’s Early College Experience Marine Science Class at Waterford High School built the boat and will follow its progress for the remainder of the school year. The students will follow the progress of both, using GPS telemetry.
[media-caption path="/wp-content/uploads/2022/11/WhatsApp-Image-2022-11-14-at-9.53.24-AM.jpeg" link="#"]The mini-boat was successfully launched from the deck of the R/V Neil Armstrong on Sunday November 13. The boat hopes to make its way across the Atlantic as did its predecessor. Credit: John Lund ©WHOI.[/media-caption]
“We are delighted to be able to support the work of the Waterford students,“ said John Lund, Chief Scientist of the Pioneer Array recovery team aboard the R/V Neil Armstrong. “Their interest, curiosity, and enthusiasm for this project is contagious, and we all will be tracking Lady Lance as she moves through the Atlantic. We also hope that some students are so inspired by this work that they go on to be scientists.”
Lady Lance is the second of such trans-Atlantic launches. The first occurred in 2016 when Lady Lance’s sister ship, Lancer, was launched from the R/V Neil Armstrong. (A good explanation of the winds and currents Lady Lance may encounter is provided at 8:30). The boat’s journey will be influenced by the wind, while the drifter’s journey will be dictated by the currents, allowing for comparisons of conditions in the ocean region.
Lancer ultimately landed in Galway, Ireland, where it was found by a young girl who was also a Sea Scout. People in Connecticut and Galway raised money to have it refurbished and it was re-launched by The Irish Marine Institute. From Ireland, the boat made its way to the United Kingdom where it landed in Plymouth, England. The boat was refurbished by the Ocean Conservation Trust at the National Aquarium in Plymouth and served as a focus for their STEMFEST, which hosted more than 50 school groups from around the UK. STEMFEST students created projects that will be sent in an upcoming Lancer launch at the end of November. An affiliated project, Project Ocean Climate Nexus (Project OCN), is hosting a conference at the National Aquarium in March. Participants will see student research based on the data produced by the mini boats and drifters, students from the US and UK presenting projects.
The Spanish Institute of Oceanography will launch Lancer at the end of November, nearly in sync with Lady Lancer’s launch from the opposite side of the Atlantic.
[media-caption path="/wp-content/uploads/2022/11/WhatsApp-Image-2022-11-14-at-9.53.27-AM-2.jpeg" link="#"]A drifter was also successfully launched to spread messages of hope about the ocean across the Atlantic. Credit: John Lund ©WHOI.[/media-caption]
“While the students have put hard work into the development of these instruments, the real hard work begins upon launch. They will be following the boat and drifter, analyzing data from the boats and adding those data points to other data available from sources like the Pioneer Array and other data sets that are publicly available, to ask questions about the physical and chemical functions of the ocean and atmosphere,” said Michael O’Connor, Waterford High School Marine Science teacher. “The project serves as a launching point to do some independent analysis and to connect with and contribute to the world through science, art, and technology.”
The students have provided digital ways for everyone to follow along with these trans-Atlantic crossings:
- Both Lancer and Lady Lance are trackable from https://educationalpassages.org/events/atsea/
- Lady Lance and her drifter can be tracked here: https://studentdrifters.org/tracks/drift_whs_2022_1.html
- Lady Lance’s drifter data can be accessed here: https://studentdrifters.org/tracks/drift_whs_2022_1.dat or .csv
Read More
OOI Launches QARTOD
WHAT IS QARTOD?
As part of the ongoing OOI effort to improve data quality, OOI is implementing the Quality Assurance of Real-Time Oceanographic Data (QARTOD) on an instrument-by-instrument basis. Led by the United States Integrated Ocean Observing System (U.S. IOOS), the QARTOD effort draws on the broad oceanographic observing community to provide manuals for different instrument classes (e.g. salinity, pH, or waves), which outline best practices and identify tests for evaluating data quality. A common code-base is available on GitHub and actively maintained by IOOS partner Axiom Data Science.
OOI has committed to implementing available QARTOD tests where appropriate. QARTOD is well-documented and actively maintained with an engaged user-base across multiple data collection and repository programs. It has a publicly available code-base with standardized tests and flag definitions that result in simplified, easy-to-interpret results. However, some instruments deployed by OOI, such as seismic sensors, hydrophones, and multispectral sensors, are not well-suited towards QARTOD. For instruments for which there is no existing QARTOD manual, such as seawater pCO2, OOI is implementing “QARTOD-like” quality control (QC).
HOW ARE QARTOD RESULTS COMMUNICATED?
QARTOD utilizes a standardized data-flagging scheme, where each data point for an evaluated variable (e.g. salinity) receives one of the following flags: 1 if the data point passed the test and is considered good; 2 if a test was not evaluated; 3 if the data point is either suspect or interesting/unusual; 4 if the data point fails the test; 9 if the data point is missing. Importantly, QARTOD only Flags data, it does not remove data. In fact, OOI is committed to delivering all available data, whether good or bad; the goal is to provide further information on the possible quality of the data. Furthermore, a flag of 3 does not necessarily mean a data point is bad – it could also mean something interesting or unusual occurred that resulted in the given data point being outside of the expected test threshold.
HOW IS QARTOD IMPLEMENTED BY OOI?
OOI is prioritizing implementation of QARTOD on instruments and variables which are shared across arrays and with broad or high scientific interest, such as CTDs, seawater pH and pCO2, dissolved oxygen, and chlorophyll/fluorescence. OOI is currently implementing the gross range and climatology tests (see this article for a more detailed description of the specific implementation). Note that the climatology test is a site-specific seasonally varying range test and not a World Ocean Atlas-like climatology. These two tests, in addition to other tests under development, utilize thresholds and ranges which are calculated from existing OOI datasets. The code used to calculate the thresholds is publicly available at the oceanobservatories ooi-data-explorations github repository and resulting threshold tables are available at the oceanobservatories qc-lookup github repository. The tests executed and results are added to the datasets as variables named _qartod_results and _qartod_executed, with the relevant tested data variable name prepended (e.g. practical_salinity would be practical_salinity_qartod_results and practical_salinity_qartod_executed). The _qartod_executed variable is a list of the individual results of each of the tests applied stored as a string. The tests applied and the order in which they were applied are stored in the variable metadata attributes. The _qartod_results provide a summary result of all the tests applied.
WHAT IS THE CURRENT OOI QARTOD STATUS?
The IOOS QARTOD manuals define the tests for each instrument class as “Required,” “Recommended,” and “Suggested”. The OOI priority will be the “Required” tests for each instrument class in use by OOI. “Recommended” and “Suggested” test development will be reviewed, with the support of subject matter experts, in the future. The IOOS QARTOD manuals can be found at Quality Assurance/Quality Control of Real Time Oceanographic Data – The U.S. Integrated Ocean Observing System (IOOS).
Current tests under development are gross range (GRT) and climatology (CT). The gap test (GT) will follow next. The syntax and location tests are considered operational checks and are handled within OOI operations and management systems. QARTOD test data will be available in specific locations where OOI supplies data, starting with M2M, and then propagated to THREDDS and Data Explorer. The current status of QARTOD test development and availability is shown in Table 1.
[media-caption path="/wp-content/uploads/2022/10/QARTOD-Table-1.png" link="#"]Table 1: Current Status of Development & Availability[/media-caption]
[media-caption path="/wp-content/uploads/2022/10/QARTOD-Figure-1.png" link="#"]Figure 1: QARTOD “Required” Test Development Timeline[/media-caption]
Read More