
News
HelpDesk Moves to Discourse

Questions submitted to OOI’s HelpDesk will now be shared and answered on OOI’s community forum on Discourse. This move was initiated in January 2021 as a way to make such queries more transparent, with the hope that the answers would help inform the broader OOI community and possibly initiate a dialogue among OOI data users themselves.
“HelpDesk questions range in complexity, depending upon the experience of OOI data users. By posting basic questions about accessing data to detailed queries about particular data, we hope to provide a resource for users at all experience levels,” said Jeff Glatstein, Senior Manager of Cyberinfrastructure and OOI Data Delivery Lead. Members of the OOI Data Team, comprised of representatives from all of the OOI arrays, answer questions relevant to data collected by the arrays. The platform offers the team a way to quickly engage with questioners and vice versa.
The team expects that some of the questions submitted will spark discussion amongst the data users themselves. “Having the questions presented on an open forum like Discourse provides an opportunity for OOI data users to share their knowledge and lend insight into specific data-related questions,” added Glatstein.
In addition to the HelpDesk, Discourse contains an FAQ section, and discussion sections for sharing of data tools, innovations, and findings, known data issues, and other areas where users’ exchange of information can be helpful. The implementation of Discourse was recommended by the OOI Facility Board as a means to encourage exchange between members of the OOI community. OOI’s forum is modeled after the Pangeo Discourse, which is a successful community of scientists and software developers working together to improve scientific research.
All OOI data users and potential OOI data users are encouraged to try out, then bookmark, Discourse. By sharing knowledge, questions and answers, OOI can join the ranks of helping to advance scientific research through engaged dialogue and collaboration. See you online!
Read More
January 31 Deadline for Applications to Consider Pioneer Array Relocation
Apply to select the next location of the OOI Pioneer Array
Applications are due on January 31st!
The Ocean Observatories Initiative Facilities Board (OOIFB) and the National Science Foundation (NSF) have launched a process to consider whether to move the Pioneer Array from its current location, on the New England shelf and slope south of Martha’s Vineyard, to a new location. Selection of the next OOI Pioneer Array location, or decision to maintain the Array at its current location, will be driven by community input on the important science questions that can be addressed by the Pioneer Array.
The OOI community is invited to weigh in on this important decision during a two-phase sequential lab approach that will bring scientists, educators, and other stakeholders together virtually to evaluate 1) future location options for the Pioneer Array and 2) new design considerations that can enable exciting research endeavors at the chosen location.
Two Innovations Labs will be held in 2021. The Phase 1 Innovations Lab, March 15-19, will explore possible locations for the Pioneer Array based on scientific questions that require an ocean observatory to advance knowledge. At the Lab, interdisciplinary teams will work together to ideate and develop a roadmap of possible locations including exploring new scientific, educational, and partnership opportunities.
The Phase 2 Innovations Lab, in late spring/early summer, will come up with a plan to maximize the science gains and broader impacts of the potential new site. If a new site is recommended, the Array would be moved in 2023.
How to become involved
For those interested in learning more, please visit the OOIFB webpage regarding the Pioneer Array location selection process. The webpage includes a link to the application form to participate in the Phase 1 Innovations Lab. The application deadline is 31 January 2021. Selected Innovations Lab participants will be announced in mid-February.
More information or to apply, please visit here.
Read MorePutting Data Explorations to Work in Classrooms
 Kathleen Browne, Chair, Geological, Environmental and Marine Sciences Department Rider University[/caption]
It all started with an email blast advertising a workshop offering opportunities to develop new lessons using OOI data. By happenstance, the workshop was right down the street from Kathleen Browne’s office at Rider University in Lawrenceville, New Jersey, making it convenient for her to attend. Sponsored by the National Science Foundation-funded OOI Ocean Data Labs at Rutgers University of New Jersey, the workshop’s focus on “data explorations” meshed nicely with Browne’s long held involvement in advancing science education plans for both higher ed and K-12 teachers. Browne teaches oceanography and served as academic director of Rider’s Science Education and Literacy Center, which works to advance K-12 and college math and science instructors’ use of inquiry-based instruction.
“Since I have been involved in a whole suite of science education lesson plans and I teach oceanography, it seemed like a unique and worthwhile opportunity, “ she explained.
Little did Browne expect that a five-day workshop would lead to her becoming an integral part of the OOI Ocean Data Labs network. She and Gabriela Smalley, a colleague in Rider’s Geological, Environmental and Marine Sciences Department (which Browne chairs) and colleagues from Maine Maritime Academy (Lauren Sahl), University of Kentucky (Rebecca Freeman), Southern Maine Community College (Carol White), and Rutgers (Sage Lichtenwaler) created an OOI data exploration on ocean anoxic events. Browne and Smalley have since also contributed to a new lab manual created by the Ocean Data Labs. Browne created labs in geology, while Smalley contributed labs on primary production and biology.
The pandemic has changed the way Browne is considering classroom instruction. “I’m in the midst of rethinking how I teach labs, particularly given all I’ve learned in these days of remote instruction. It’s hard to teach an oceanography lab remotely when students are clearly looking for something different than what we can do remotely. I imagine, for example, we might use the intro labs in the lab notebook in the beginning of the semester because we are finding that students really need focused guidance on describing patterns in data sets before they can make sense of the results.
“Students struggle with understanding data. But, the need for data analysis is not limited to science. It’s important in politics, health care, and most aspects of life today. We live in a world where an enormous amount of data is presented to us daily. It’s not that everyone needs to process that data, but they do need to at least make sense of the data visualizations that might be offered. It’s my hope that my students can do that so they might be able to recognize when something doesn’t make sense. I’d like my students to be better consumers of data, and skeptics of data so they are not misled.”
Browne‘s interest in the business of students struggling to describe patterns in data has prompted a project to figure out the best instructional ways to help students develop data literacy skills to improve their scientific explanation skills. She teamed with Smalley, Andrea Drewes, a learning scientist in Rider’s Graduate Education, Leadership and Counseling department, and Sage Lichtenwaler, a lead investigator and data wrangler with Ocean Data Labs, on a recently funded NSF project. The project will assess students’ data and science literacy skills — that is understanding the scientific principles involved. The project will use a variety of techniques and resources, including the Ocean Data Lab’s data explorations.
“Our approach will be to help students develop their data literacy skills such as the ability to read a graph correctly and identify and articulate in detail the patterns and trends that they see in the data. With those skills refined we will help to help students learn the science in our courses so they are able to explain something they learned about the data and the science using scientific evidence and reasoning.”
The effectiveness of this approach will be tested in two different classroom settings. One will serve as a control, while the other will integrate tools and instruction to help students work with data visualizations. Ultimately, the team will assess the learning gains in the control and intervention classes. Successful techniques identified will be shared broadly with science instructors, learning scientists, and other educational researchers throughout the nation to improve data literacy among U.S. students.
Browne and her team will begin the formal data collection this fall and expect to report their findings in 2023. “My work with OOI data and the Ocean Data Labs has opened up new avenues of exploration for me, and ultimately will help students’ abilities to use data and science literacy skills to contribute as active citizens to pressing ocean-related issues in the world.”
Read MoreShould the Pioneer Array be moved? If so, where?
In 2021, the Ocean Observatories Initiative Facilities Board (OOIFB) and the National Science Foundation (NSF) are launching a process to consider whether to move the Pioneer Array from its current location, on the New England shelf and slope south of Martha’s Vineyard, to a new site. Selection of the next OOI Pioneer Array location, or decision to maintain the Array at its current location, will be driven by community input on the important science questions that can be addressed by the Pioneer Array.
The OOI community is invited to weigh in on this important decision during a two-phase sequential lab approach that will bring scientists, educators, and other stakeholders together virtually to evaluate 1) future location options for the Pioneer Array and 2) new design considerations that can enable exciting research endeavors at the chosen location.
Two Innovations Labs will be held in 2021. The Phase 1 Innovations Lab, March 15-19, will explore possible locations for the Pioneer Array based on multiple factors, driven by scientific questions that require an ocean observatory to advance knowledge. At the Lab, interdisciplinary teams will work together to ideate and develop a roadmap of possible locations including exploring new scientific, educational, and partnership opportunities.
The Phase 2 Innovations Lab, in late spring/early summer, will come up with a plan to maximize the science gains and broader impacts of the potential new site. If a new site is recommended, the Array would be moved in 2023. The OOI Coastal and Global Scale Nodes (CGSN) Team at Woods Hole Oceanographic Institution would continue the operation and maintenance of the array, regardless of its location.
The Lab’s findings will be considered by an NSF review panel, which will report to NSF in early fall on the new Pioneer Array location and how it can be optimized for science and education.
How to Become Involved
For those interested in learning more, a 60-90-minute informational session, Phase 1 Micro Lab, is planned for 13 January 2021, beginning at 1 pm Eastern. Representatives from NSF along with CGSN, the current operator of the Pioneer Array, will present information about the selection process and technical details about the Pioneer Array.
Individuals interested in applying for the Phase I Innovations Lab are encouraged to attend the Micro Lab. The information provided could be useful in submitting an application. To attend the Phase 1 Micro Lab, please RSVP here.
The application to participate in the Phase 1 Innovations Lab is available here. The application deadline is 31 January 2021.
Selected Innovative Lab participants will be announced in mid-February. Participants selected for Phase I will also be considered for Phase II.
What to Expect
The Innovations Labs will bring together scientists, stakeholders, and educators. Interdisciplinary teams will work together for six-hour days for the full week. Teams will form, pitch, and refine plans (based on input from experts and other participants). Participants will meet virtually each day of the week (M-F). Four days will be for synchronous meetings and one day will be dedicated to asynchronous team work
To learn more or to apply, click here.
Read More
Passing of Dr. Larry Atkinson
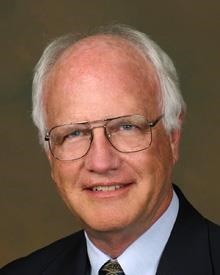
[caption id="attachment_20086" align="alignleft" width="240"]
Larry P. Atkinson[/caption]
The OOI Team notes with great sadness the passing of Dr. Larry Atkinson on December 22nd, 2020. Larry was Eminent Scholar Emeritus and Professor Emeritus of Ocean, Earth and Atmospheric Sciences in the Department of Ocean, Earth and Atmospheric Sciences and the Center for Coastal Physical Oceanography at Old Dominion University. In addition to significant contributions to oceanographic research and education throughout a distinguished career at a number of institutions, Larry served for many years as Chair and then Past Chair of the OOI Facilities Board (OOIFB), which provides independent input and guidance regarding the management and operation of the OOI to the National Science Foundation.
Throughout his many years of service on the OOIFB, Larry provided valuable advice and consistent encouragement as the program was being implemented and developed. In 2020, in recognition of his many contributions, the OOIFB established the Larry P. Atkinson Travel Fellowship for Students and Early Career Scientists, which will enable students and scientists from across the globe to meet and advance the understanding of the ocean. Larry will be greatly missed by those members of the OOI Team who worked closely with him, and by the many more who were influenced and impacted by his steadfast wisdom and support.
Larry’s obituary can be read here.
Read MoreOcean Visions: New RCA Video Tells Grand Visual Story

Ocean Visions – The story of the Regional Cabled Array
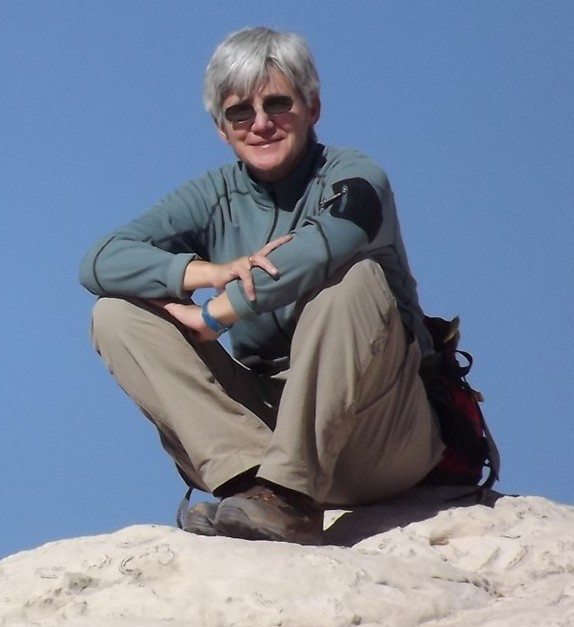
Sarah Smith is not your typical undergraduate. She is a 41-year-old communications major at the University of Washington (UW) Tacoma, who used her life experience and creative talent to produce a nine-minute video Ocean Visions that tells the story of the Ocean Observatories Initiative Regional Cabled Array. The production is stunning and Smith achieved her goal of showing the human side of science. Smith served as writer, producer, and director of the production.
“I wanted to show the human side of science…that people come up with big ideas like the Regional Cabled Array. And, these big ideas that take years to come to fruition and so much money to realize, “ Smith explained. “I also wanted to convey that there are these dedicated people out there working hard at what they are passionate about, continually asking questions. While people might romanticize ocean research, it’s really hard work. It’s dangerous and conditions can be wild. I wanted viewers to see and understand all that it takes to make these big ideas happen.”
Smith’s former work as a photographer and visual artist is apparent in this nine-minute video, about the Regional Cabled Array, which provides electricity and Internet to >150 instruments measuring ocean and Earth conditions. Working initially with UW oceanography professor Cheryl Greengrove, Smith had hoped to be aboard the R/V Thomas G. Thompson this past summer with the scientific team as part of their educational VISIONS program. COVID-19 put an end to those plans. Instead, she spent hours and hours going through footage in RCA’s considerable archive of video and images of life below the surface, Interactive Oceans. (She’s hoping that the stars will align and a trip aboard the R/V Revelle will be possible next summer during RCA’s regular operations and maintenance cruise.)
“It’s hard to estimate how many hours I spent on the project. Sometimes it felt like I was living and breathing the project, but it was an incredible experience for which I am grateful,” she said. Smith did everything from schlepping the camera equipment, making sure the lighting was right, asking the questions, and spending hours in the editing room to ensure the story of the RCA was accurate and compelling.
Smith will graduate next month with a major in communications. She has an internship lined up after that with NASA where she will be working with its STEM program connecting students with the International Space Station. From there, she plans on heading to graduate school in a cinema and media studies program. “I just want to keep exploring. Video and film are such important communication tools, which are constantly evolving. I want to be part of that changing story to continue to tell stories of people who doggedly follow their curiosity as did those involved in making the RCA a reality.”
Read More
Recordings of OOI Events at AGU
Just in case you missed some of the events at OOI’s virtual booth at AGU, we’ve compiled some recordings and information so you can watch as your schedule allows:
[embed]http://https://youtu.be/Wuc-Be-IFVA[/embed] [embed]https://www.youtube.com/watch?v=WuEXjlXl-HM&t=5s[/embed] [embed]https://www.youtube.com/watch?v=bWqvOzyYirE[/embed]How Scientists are Using OOI Data to Advance Their Research
Learn How to Create a Data View
[embed]https://youtu.be/uRd0Js9L0-I[/embed]Virtual Tours
[embed]https://www.youtube.com/watch?v=3w3RyvUGeLA[/embed] [embed]https://www.youtube.com/watch?v=GqJdkqI-unw&t=19s[/embed] [embed]https://youtu.be/epkV9K6_w4U[/embed] Read MoreJoin in the Conversation: New Forum Live!
[media-caption path="/wp-content/uploads/2020/11/Discourse_logo.png" link="#"]Source: Discourse Team[/media-caption]
The Ocean Observatories Initiative would like to hear from all data users and potential data users. To that end, we have launched a platform on Discourse to encourage “discourse.” The OOI Data Users Discussion Forum is a place where scientists, educators, and other data users can come together to ask and have questions answered and share how OOI data are being used to advance research and learning.
Some of the topics covered are
- data tools (where you can learn new techniques for using data)
- known data and system issues and updates on their status
- potential funding and job opportunities
- FAQS that will help you navigate and use OOI data
- HelpDesk, where you can seek help and learn about other help requests that may shed light on your question
- news and announcements that are relevant to using OOI data in research and in the classroom.
Since it is a user-based forum, you can add categories and questions of interest to you.
Sign on today or bookmark this url https://discourse.oceanobservatories.org/ for future engagement. Once you sign up, you will receive an email confirming you are not a bot, then the conversation can begin.
We are looking forward to some lively discussions! See you online.
Read More
OOI’s AGU Virtual Booth and Sessions Schedule 2020
OOI’s Virtual Booth
The Ocean Observatories Initiative has a full plate of activities at its virtual AGU booth during AGU’s exhibit hall hours. Registration is required for the 11 am-noon time slots, indicated below.
Friday 11 December
- 11 am-noon Eastern: Learn how to create data views using the new Date Explorer: Register here.
OOI Data Team and Coastal Endurance team member Craig Risien will guide us through the steps of creating a data view using Coastal Endurance array data to demonstrate this feature of OOI’s new data discovery tool, Data Explorer.
- 1-1:30 pm Eastern: Ask an expert about what scientists are learning using OOI data. Join here.
Join William Wilcock, University of Washington, and Hilary Palevsky, Boston College, to hear what they have learned using OOI data and how you might do the same.
- 6-7 pm Eastern: Early Career Scientists’ Happy Hour. Join here.
Close down the OOI virtual booth by joining your friends and colleagues at a virtual hour. This is an opportunity to network, reconnect with friends and colleagues, and raise a glass together.
All activities other than the 11 am time slots and Friday’s happy hour can be accessed here. Look forward to seeing you soon!
___________________________________________________________________________________________
OOI-Related Sessions
Friday, 11 December 2020
07:00 – 23:59
Posters
B060-0022 Western boundary current instability gives rise to extraordinary subsurface diatom blooms in the Middle Atlantic Bight slope sea
Hilde Oliver1, Weifeng Gordon Zhang1, Walker O Smith Jr2, Philip Alatalo3, Dreux Chappell4, Andrew Hirzel1, Gwyneth Packard5, Corday Selden6, Judson Poole1, Heidi M Sosik1, Rachel Stanley7, Yifan Zhu4 and Dennis Joseph McGillicuddy Jr8, (1)Woods Hole Oceanographic Institution, Woods Hole, MA, United States, (2)Virginia Inst Marine Sciences, Gloucester Point, VA, United States, (3)Woods Hole Oceaonographic Institution, Woods Hole, MA, United States, (4)Old Dominion University, Ocean, Earth and Atmospheric Sciences, Norfolk, VA, United States, (5)Woods Hole Oceanographic Institution, Woods Hole, United States, (6)Cuernavaca, Mexico, (7)Wellesley College, Wellesley, MA, United States, (8)Woods Hole Oeanographic Institution, Woods Hole, MA, United States
Monday, 14 December 2020
07:00 – 23:59
Posters
OS037-0009 Sustained Ocean Observatories Initiative Glider Measurements Over the Oregon and Washington Shelves
Stuart Pearce, Oregon State University, College of Earth, Ocean, and Atmospheric Sciences, Corvallis, OR, United States, Jonathan Whitefield, Oregon State University, College of Earth Ocean and Atmospheric Sciences, Corvallis, OR, United States and Edward Paul Dever, Oregon State University, Corvallis, OR, United States
A151-0011 On the Impact of High-Frequency Wind Variability on Upper Ocean Stratification
Natalie M Freeman, University of Colorado at Boulder, Department of Atmospheric and Oceanic Sciences, Boulder, CO, United States, Donata Giglio, University of Colorado Boulder, Department of Atmospheric and Oceanic Sciences, Boulder, CO, United States, Sarah T Gille, UCSD, La Jolla, CA, United States and Momme Claus Hell, University of California San Diego, Scripps Institution of Oceanography, La Jolla, CA, United States
ED037-0031 What drives variability in nitrate concentration off the Oregon Coast?
Bailey Armos, University of Washington, Oceanography, Seattle, WA, United States and Edward Paul Dever, Oregon State University, Corvallis, OR, United States
ED037-0035 Ocean pCO2 Variability and Drivers at the US Atlantic Coastal Pioneer Array
Alison Thorson, Sarah Lawrence College, Bronxville, NY, United States and Rachel Eveleth, Oberlin College, Oberlin, United States
OS036-0005 Dissolved Oxygen Over The Oregon And Washington Shelves Observed From Sustained Glider, Profiler, And Fixed Depth Time Series
Edward Paul Dever1, Jonathan P Fram2, Michael Vardaro3,4, Wendi Ruef5, Orest Eduard Kawka5, Jack A Barth6, Craig M Risien2, Christopher E Wingard2, Stuart Pearce2 and Jonathan Whitefield1, (1)Oregon State University, Corvallis, OR, United States, (2)Oregon State University, College of Earth, Ocean, and Atmospheric Sciences, Corvallis, OR, United States, (3)Rutgers University, Department of Marine and Coastal Sciences, NJ, United States, (4)University of Washington Seattle Campus, Oceanography, Seattle, WA, United States, (5)University of Washington, School of Oceanography, Seattle, WA, United States, (6)Oregon State University, Marine Studies Initiative, Corvallis, OR, United States
ED037-0044 Vertical Zooplankton Distribution on Continental Slope off Oregon Coast
Lydia Sgouros, Case Western Reserve University, Cleveland, OH, United States and Edward Paul Dever, Oregon State University, Corvallis, OR, United States
Wednesday 16, December 2020
07:00 – 23:59
Posters
V040-0016 Monitoring Hydrothermal Plumes at ASHES Vent Field, Axial Seamount through Quantitative Acoustic Imaging
Guangyu Xu, Applied Physics Laboratory University of Washington, Acoustics, Seattle, WA, United States, Karen G Bemis, Rutgers, The State University of New Jersey – New Brunswick, Marine and Coastal Sciences, New Brunswick, NJ, United States, Darrell Jackson, University of Washington Seattle Campus, Applied Physics Laboratory, Seattle, WA, United States and Anatoliy N. Ivakin, Applied Physics Laboratory University of Washington, Seattle, WA, United States
14:50 – 14:54
Virtual Talk
V043-06 Repeated Short-Term Deflation Events Observed During Long-Term Inflation at Axial Seamount
William W. Chadwick Jr1, Scott L Nooner2, William S D Wilcock3, Suzanne M Carbotte4, Audra Meaghan Sawyer5, Erik K Fredrickson3 and Jeff W Beeson1, (1)Oregon State University, CIMRS, Newport, OR, United States, (2)University of North Carolina at Wilmington, Dept of Earth and Ocean Sciences, Wilmington, NC, United States, (3)University of Washington, School of Oceanography, Seattle, WA, United States, (4)Lamont-Doherty Earth Obs, Palisades, NY, United States, (5)University of North Carolina at Wilmington, Wilmington, NC, United States
Read More