
Science Highlights
Accelerating Marine Ecological Research
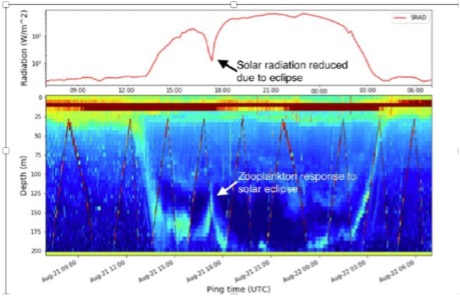
Mid-trophic level organisms, such as zooplankton and forage fish, play a critical role in mediating energy transfer from primary production to top predators in the marine ecosystem. Using Coastal Endurance Array echosounders, scientists are observing long-term changes in the distribution and abundance of this important part of the marine food web.
Read MoreNew View of Biological Carbon Pump
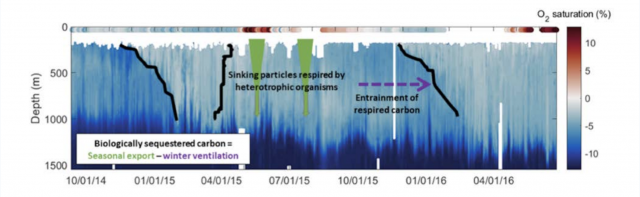
The ocean’s biological carbon pump plays an important role in the global carbon cycle. Using OOI data from the Global Irminger Sea Array, researchers discovered that much of the organic carbon exported from the surface is ventilated back to the atmosphere, rather than being sequestered long-term as had been previously thought.
Read MoreSlope and Shelf Flow Anomalies Off Oregon
Slope and Shelf Flow Anomalies Off Oregon Influenced by the El Niño Remote Oceanic Mechanism in 2014–2016
Adapted and condensed by OOI from Kurapov et al., 2022, doi.org/10.1029/2022JC018604.
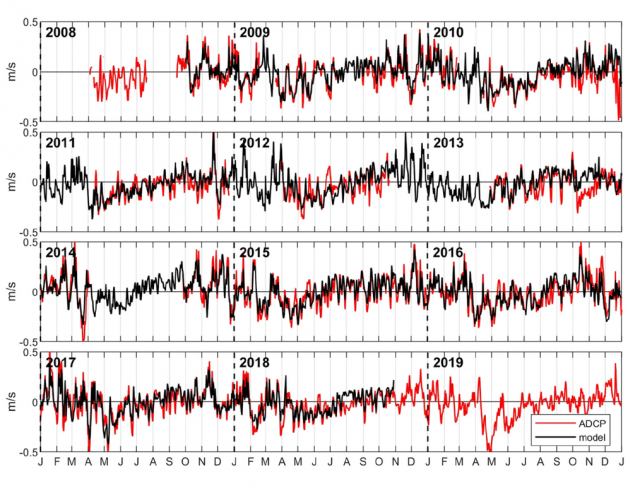
[media-caption path="/wp-content/uploads/2023/01/Endurance-science-highlight-fixed.png" link="#"]Time series of the daily averaged meridional current component at the Oregon shelf location, averaged in the vertical between 60 and 70 m below the surface: (red) ADCP data and (black) model. Data from before 2015 come from various moorings maintained at the NH-10 site. Data after 2015 come from the OOI Oregon shelf site. The model reproduces the observed variability over the entire 10-year period very well, except for episodes in Dec 2010 and Oct 2013. Overall, no systematic biases or trends are found. See Fig. 7 Kurapov et al. (2022).[/media-caption]Kurapov et al. analyze outputs of a regional ocean circulation model to demonstrate the measurable impact of the El Niño remote oceanic forcing mechanism along the US West Coast during the major heat wave period of 2014–2016. The 2-km horizontal resolution model, based on the Regional Ocean Modeling System (ROMS), was run for the period of 2009–2018. Though the model does not assimilate observations, it performs well by comparison with time series data (including OOI data, Figure above) explaining observed variability on temporal scales from several days to seasonal and interannual.
The El Niño-related oceanic anomalies provided by a global state estimate are introduced in the regional model at the southern boundary at 24N. These propagate alongshore with coastally trapped waves (CTWs) and influence the variability off Oregon (41°–46°N). In particular, CTWs are evident in the subsurface along-slope current, vs, and in the depth of the 26.5 kg m3 isopycnal surface over the slope, z26.5. In summer 2014 and 2015, vs anomalies are positive (northward) and z26.5 anomalies are negative (deeper) along the US West Coast. In addition to the CTW patterns, z26.5 anomalies also exhibit slow-moving features associated with undercurrent widening, separation, and subsurface eddy variability. Over the Oregon shelf, El Niño conditions contributed to the sharp weakening of the southward alongshore current throughout the water column in July 2014 and 2015, despite the near-average southward, upwelling-favorable winds.
Kurapov, A. L., Rudnick, D. L., Cervantes, B. T., & Risien, C. M. (2022). Slope and shelf flow anomalies off Oregon influenced by the El Niño remote oceanic mechanism in 2014–2016. J. Geophys. Res.: Oceans, 127, e2022JC018604. doi.org/10.1029/2022JC018604.
Read MorePythias Oasis: The First-of-Its-Kind Seep in the Oceans
Adapted and condensed by OOI from Philip, et al., 2023, doi: 10.1126/sciadv.add6688.
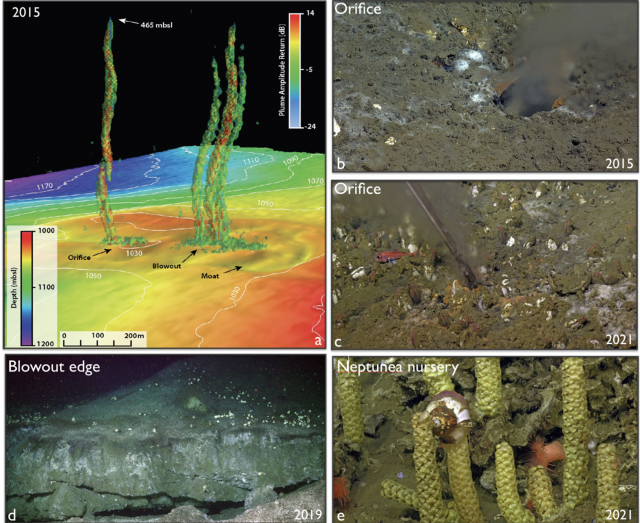
[media-caption path="/wp-content/uploads/2023/01/Screen-Shot-2023-01-26-at-10.21.55-AM.png" link="#"] a) A multibeam sonar image of the methane bubble plumes at Pythias Oasis in 2015. b) Pythias orifice in 2015 showing the fluid-dominated, sediment-rich plume, as first visualized on the discovery dive by the ROV ROPOS. The main orifice has been continuously active since 2015. c) Pythias’ orifice in 2021 with increased biological communities and a small Fe-rich chimney. d) The edge of a large collapse-blowout zone – coring across this area in 2019 recovered substantial methane hydrate. e) A Neptunea snail nursery between the orifice site and the blowout zone.[/media-caption]Pythias Oasis is the first-of-its-kind seep in the oceans, providing a window into controls on megathrust events along the Cascadia Margin. Pythias Oasis, discovered during the 2015 Regional Cabled Array (RCA) Operations and Maintenance Cruise, utilizing the hull-mounted sonar on the R/V Thompson, is unlike any seep site yet described along active margins with unprecedented fluid chemistries (Figure above). It hosts an intense fluid-dominated venting system issuing low-salinity, hydrocarbon-bearing fluids carrying low concentrations of suspended particles from a discrete orifice that has been continuously active since 2015. Detailed sampling, as part of an NSF OCE-funded expedition in 2019 (OCE 16582901), and another dive in 2021 (added onto the RCA 2021 cruise) show that the fresh, warm fluids (four times background temperatures) are venting at the highest discharge rates yet measured within the Cascadia Subduction Zone (CSZ) and that the fluids are extremely enriched in boron lithium and iron.
Pythias Oasis provides a rare window into processes acting deep in the margin with fluid chemistries indicating that the fluids are sourced near the plate boundary in the Central CSZ at minimum temperatures of 150-250°C. The high discharge rates are thought to reflect draining of fluids along an over-pressurized reservoir associated with the subduction zone-perpendicular Alvin Canyon strike slip fault, suggesting that the faults regulate pore fluid pressure and megathrust slip behavior along the Central CSZ.
Results from this work are presented in Philip, B.T., E.A. Solomon, D.S. Kelley, A.M. Tréhu, T.L. Whorley, E. Roland, M. Tominaga, and R.W. Collier (2023) Fluid sources and overpressures within the central Cascadia Subduction Zone revealed by a warm, high-flux seafloor seep. Science Advances (9), doi: 10.1126/sciadv.add6688.
Read MoreAn Overview of Ambient Sound Using OOI Hydrophones
Adapted and condensed by OOI from Ragland, et al., 2022, doi.org/10.1121/10.0009836.
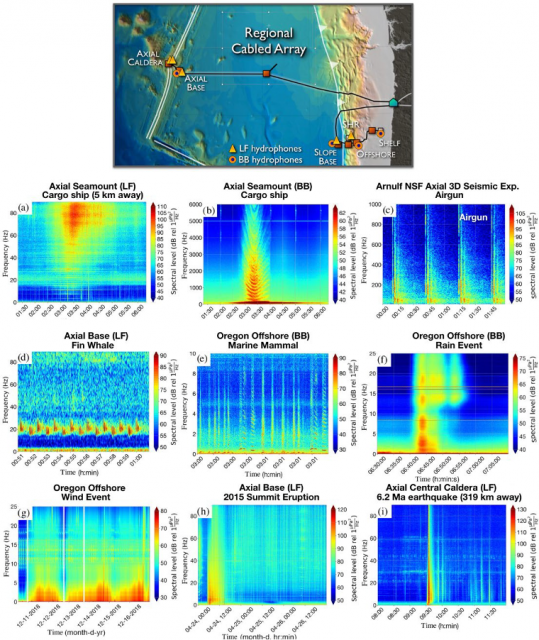
[media-caption path="/wp-content/uploads/2022/11/RCA-highlight.png" link="#"]Figure 1: Highlights of acoustic features from the five low frequency (Fs=200Hz) and six broadband (Fs = 64 kHz) hydrophones on the RCA.[/media-caption]Ragland et al., (2022) provides a wonderful overview of the unique opportunities for data and experimentally driven advancements in acoustics that are provided by (long-term) ambient sound recordings streamed live from hydrophones on the Regional Cabled Array. Figure 1, above (after Figure 5, Ragland et al., 2022), highlights acoustic features from the five low frequency (Fs=200Hz) and six broadband (Fs = 64 kHz) hydrophones on the RCA. Areas of research span the rare ability to conduct offshore monitoring of Fin whale migration, and the seasonal fluctuations and decade-long evolution of their calls, in situ offshore meteorological measurements with high temporal resolution to study wind and rain noise in the NE Pacific, the sound from commercial ships with impacts on the oceanic environment and marine life, ambient noise interferometry, volcanic eruptions, and both local and far-field earthquakes. As the authors note, the RCA-OOI data also provide significant opportunities for the development of machine learning tools for ocean acoustics. This work was supported by an award from the Office of Navy Research. The authors developed a public Python package (OOIPy) to access and explore the hydrophone data more easily (Schwock et al., 2021). OOIPy is also accessible through the OOI website tab Community Tools and Datasets.
__________________________________________________________
Ragland, J., F. Schwock, M. Munson, and S. Abadi (2022) Journal of the Acoustic Society of America, 151, 2085-2100, https://doi.org/10.1121/10.0009836.
Schwock, F., J. Ragland, L. Setiawan, M. Munson, D. Volodin, and S., Abadi (2021). OOIPY v1.1.3: A Python toolbox designed to aid in the scientific analysis of Ocean Observatories Initiative data, https://doi.org/10.5281/zenodo.5889288.
Read More
Southern Ocean Sea Ice Predictability
Adapted and condensed by OOI from Cerovecki, et al., 2022, doi: /10.1088/1748-9326/ac7d66.
Forecasting Antarctic sea ice conditions, including specifics such as the position of the ice edge in the Southern Ocean, are substantial challenges. As a part of the Polar Prediction Project, there is a focus on improving coupled air-sea-ice prediction models and determining key sources of forecast errors. In a recent study, Cerovecki et al. (2022) show that sea ice forecast skill is linked to the accuracy of the surface forcing, and in particular, the net surface radiation. The goal of the study was to quantify errors that degrade the skill of Southern Ocean sea ice forecasts during the freezing season. They conclude that accurately modeling the surface downward longwave radiation (DLW) component of the net surface radiation is critical to sea ice prediction over the Southern Ocean.
The authors review prior results indicating that climate models have different behaviors in different seasons relative to ground truth. In spring and summer, the models over-estimate the net surface radiation whereas in winter the models under-estimate the net longwave radiation. Recognizing that these issues relate to representations of cloud cover, which can be diagnosed using DLW, the authors also note that some models showed DLW biases of up to 100 W/m2 compared to ground truth. These results were based on comparisons at McMurdo Station, Antarctica, whereas the authors were interested in processes occurring near the ice edge where few direct observations are available.
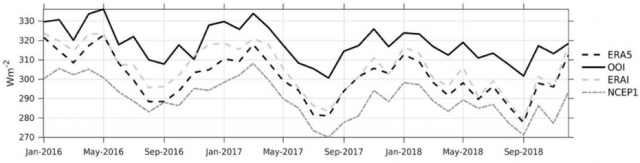
[media-caption path="/wp-content/uploads/2022/11/CGSN-highlight.png" link="#"]Figure 1. Monthly mean downward longwave radiation (DLW) for Jan 2016 – Nov 2018 from the OOI Southern Ocean buoy (solid), and three reanalysis products: ERA5 (black dash), ERA-Interim (long grey dash) and NCEP1 (short gray dash). From Ceroveki et al., 2022.[/media-caption]
The OOI Southern Ocean surface mooring provided a rare source of in-situ air-sea flux data for comparison. The study used DLW from the METBK instrument package on the OOI Southern Ocean buoy to compare with results from the ECMWF Interim reanalysis (ERAI), the ERA fifth- generation reanalysis (ERA5), and the NOAA National Centers for Environmental Prediction reanalysis (NCEP1). Despite some data gaps, the 1 min OOI METBK observations for Jan 2016 – Jan 2020, were critical to determining model biases. Hourly mean DLW data from the two METBK packages were averaged together to create the observational record.
Comparison of the observed monthly mean DLW with reanalysis output showed systematic underestimates by the models relative to the observations. The nature of the offsets is shown in Figure 1 – the reanalysis models do a relatively good job of capturing month to month variability, but with a consistent low bias. The mean offsets range from -13 W/m2 for ERAI to -28 W/m2 for NCEP1. These biases are comparable to those diagnosed at McMurdo Station, and suggest that the ERA5 DLW radiation underestimate is of the order of 20–50 W/m2. This is consistent with the finding that coupled model forecast systems over-estimate sea ice growth.
The authors conclude that a significant deficit in reanalysis DLW, related to the accuracy of cloud representation in the models, is a common problem over the Southern Ocean and impacts the skill of sea ice cover prediction. In particular, the ERA5 reanalysis may underestimate DLW by up to 50 W/m^2 during the during the freezing season. The OOI Southern Ocean data, from the furthest south sustained air-sea flux mooring, proved uniquely valuable in codifying these results.
______________________________
Cerovecki, I, R. Sun, D.H. Bromwich, X. Zou, M.R. Mazloff and S -H.Wang (2022). Impact of downward longwave radiative deficits on Antarctic sea-ice extent predictability during the sea ice growth period. Environ. Res. Lett. 17 084008. DOI: /10.1088/1748-9326/ac7d66.
Read More
Particle Trajectories in an Eastern Boundary Current
Adapted and condensed by OOI from Wong-Ala et al., 2022, doi:/10.1016/j.jmarsys.2022.103757
To study the transport and dispersal of marine organisms during spawning, Wong-Ala* et al. developed and applied a Lagrangian particle tracking (LPT) model to compare and contrast particle drift patterns during the spring transition off the Oregon coast. They studied the Oregon coast as it has distinct upwelling and downwelling regimes and variable shelf width. They contrasted years (2016–18) using Regional Ocean Modeling System (ROMS) with different horizontal spatial resolutions (2 km, 250 m). They found the finer spatial resolution model significantly increased retention along the Oregon coast. Particles in the 250 m ROMS were advected to depth at specific times and locations for each simulated year, coinciding with the location and timing of a strong and shallow alongshore undercurrent that is not present in the 2 km ROMS. Additionally, ageostrophic dynamics close to shore, in the bottom boundary layer, and around headlands not present in the coarser model emerged in the 250 m resolution model. They concluded that the higher horizontal model resolution and bathymetry generated well-resolved mesoscale and submesoscale features (e.g., surface, subsurface, and nearshore jet) that vary annually. These results have implications for modeling the dispersal, growth, and development of coastal organisms with dispersing early life stages.
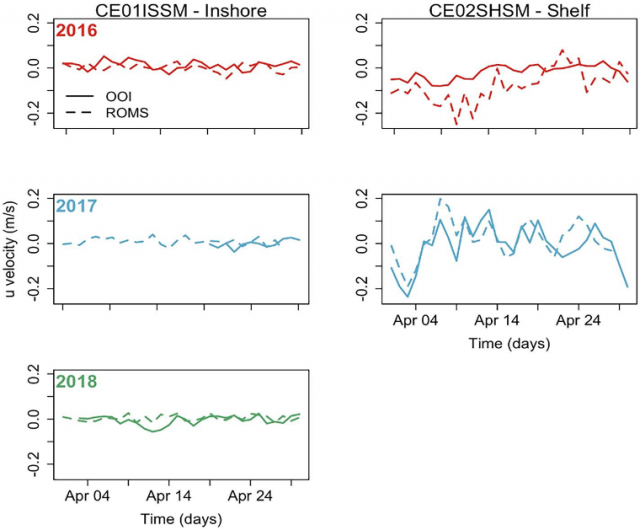
[media-caption path="/wp-content/uploads/2022/11/Endurance-Highlight.png" link="#"]Figure 1: (Fig 9 from Wong-Ala et al. (2022). Comparison of u-velocity (zonal velocity) data between the 250 m ROMS and an inshore mooring and shelf mooring off the Oregon coast collecting data at seven meters depth. The panel is organized by year: 2016 (row 1), 2017 (row 2), 2018 (row 3), and location of data collection: inshore (column 1) and shelf (column 2). In April 2018, there are no data available from the shelf mooring ADCP.[/media-caption]The model applied by Wong-Ala assimilates satellite sea surface temperature and along-track altimetry. Model atmospheric forcing is from the NOAA North American Mesoscale Model (NAM). To validate their model, Wong-Ala et al., used OOI Endurance Array time series data from 2016 to 2018 from the Oregon inshore and shelf moorings (CE01ISSM and CE02SHSM). They compared available OOI zonal and meridional velocities, temperature, and salinity to model output of these parameters for the month of April in each year when they ran their model (Figure 1). They found the modeled currents and temperature from the 250 m ROMS model closely follow the observed data from inshore and shelf moorings compared to the 2 km ROMS. The 250 m ROMS modeled currents and observed currents at the inshore mooring are similar for all three years (Figure 1).
They also found that the 250 m ROMS modeled temperature and observed data are similar in 2017 at the inshore and shelf location. In April 2017 and 2018, the modeled temperature from the 250 m ROMS is about 1 °C cooler than the observed temperatures.
_____________________
*Wong-Ala is a PhD student at Oregon State University. She is a Pacific Islander.
Reference:A. T. K. Wong-Ala, Ciannelli, L., Durski, S. M., and Spitz, Y., Particle trajectories in an eastern boundary current using a regional ocean model at two horizontal resolutions, Journal of Marine Systems, vol. 233, p. 103757, 2022. https://doi.org/10.1016/j.jmarsys.2022.103757.
Read MoreVisions’22: Changing Students Lives
From Deb Kelley, UW, in OOI Quarterly Report, 2022.
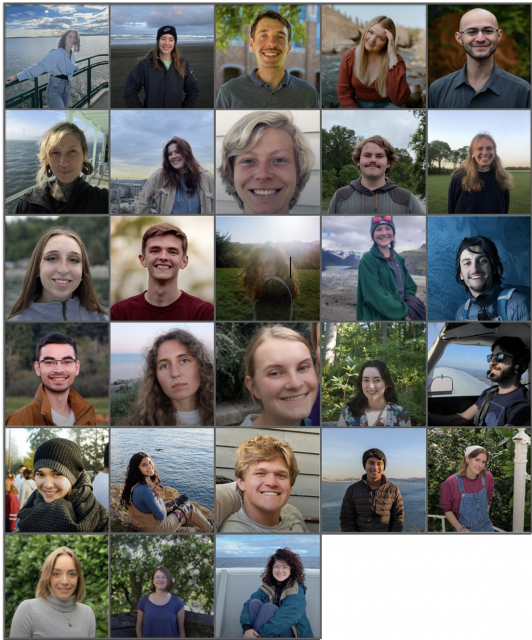
This year, 25 undergraduate students and three graduate students participated on the Regional Cabled Array Operations and Maintenance cruise as part of the VISIONS’22 at-sea experiential learning program. They include students from the US, India, Saudi Arabia, France, and Kazakhstan. They represent a breadth of disciplines spanning Oceanography (11), Engineering (9: Mechanical, Industrial, Bioengineering, Environmental, and Aeronautics and Astronautics), Biology (6: Biology, Marine Biology, and Microbiology), Geology (1), and Policy Studies focused on the United Nations Convention (1). They stood 4 hour-on, 8 hour-off watches in the remotely controlled vehicle, ROPOS control center, learned how to conduct CTD casts and collect and process fluid samples, and worked on deck. Three additional undergraduate student ambassadors, who have participated in past VISIONS’ expeditions (1-3 years), helped mentor the students. All completed cruise blogs on the Interactiveoceans VISIONS’22 Expedition site, and science-engineering and/or engagement projects that will last a quarter to several years. Two students chose projects involving advanced genetic analyses of vent animals and protists for their Senior Thesis in Oceanography. Based on discussions with past students and what they relayed in their blogs, for many this is a life changing experience. Note: two past VISIONS students are now APL engineers as part of the RCA team.
Read More
Chlorophyll Enhancement at the Shelfbreak
Adapted and condensed by OOI from Oliver et al., 2022, doi:/10.1029/2021JC017715.
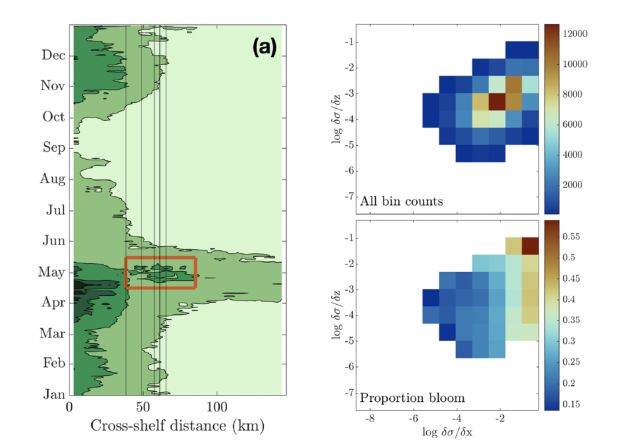
[media-caption path="/wp-content/uploads/2022/08/Screen-Shot-2022-08-18-at-3.10.51-PM.png" link="#"](left) Eighteen-year composite annual cycle of surface chlorophyll concentration from MODIS satellite. Vertical lines indicate the shelfbfreak region (depths 75 to 1,000 m); red box highlights chlorophyll enhancement at the shelfbreak. (right; upper) OOI glider data with more than 100 chlorophyll observations within horizontal and vertical density gradient bins and (lower) proportion of bins with chlorophyll > 2 mg/L, indicating a bloom. From Oliver et al., 2022.[/media-caption]The enhancement of chlorophyll due to phytoplankton blooms is recognized to occur near the frontal boundary of the New England Shelf, but the blooms are ephemeral and not consistently found in satellite remote sensing of ocean color. In a recent study, Oliver et al., (2021) show that enhanced surface chlorophyll concentrations at the shelfbreak are short lived events, and are associated with periods when a surface layer of lighter shelf water moves over denser slope water at the shelfbreak front. Both data and a computational model show that eastward, upwelling-favorable winds are the primary driver of the frontal restratification and localized enhanced surface chlorophyll.
The study used a variety of data sources, including MODIS satellite chlorophyll estimates, shipboard CTD casts from a Shelf-break Productivity Interdisciplinary Research Operation at the Pioneer Array (SPIROPA) cruise and a Pioneer mooring turn cruise, Pioneer glider density and chlorophyll, and atmospheric reanalysis winds after comparison with Pioneer surface mooring winds. A two-dimensional configuration of the Regional Ocean Model System (ROMS) coupled to a nitrogen-phytoplankton-zooplankton-detritus (NPZD) model was used to simulate the wind-driven response.
The eighteen-year time-evolution of the cross-shelf distribution of surface chlorophyll concentration from MODIS showed that shelf-break chlorophyll enhancements were evident in most years, followed an inshore spring bloom in April, and were typically seen during a short period in the spring (mid-April – mid-May; Figure above). For individual years, the shelf-break chlorophyll enhancements were short-lived, typically lasting less than a week. Pioneer Array glider data were used to explore the relationship between enhanced chlorophyll concentrations and both horizontal (assumed to be associated with the shelfbreak front) and vertical density gradients. Near surface (upper 30 m) chlorophyll concentrations were collected in log-transformed density gradient bins and then displayed according to the proportion of bins with chlorophyll > 2 mg/L, indicating a bloom. The “bloom bins” were associated with high horizontal density gradients and a range of vertical density gradients, indicating that frontal restratification is associated with enhanced chlorophyll at the shelfbreak (Figure above).
The study concludes that enhanced surface chlorophyll events at the New England shelfbreak occur consistently in the spring, but are transient, lasting only a few days to a week, and thus not discernible in seasonal climatologies. Periods of enhanced chlorophyll are associated with strong horizontal density gradients and appear to be triggered by the increase in stratification resulting from wind-driven cross-shelf advection of less dense shelf water over denser slope water. This process creates a shallow mixed layer at the front which alleviates light limitation and supports transient surface enhancements of chlorophyll.
Oliver, H., Zhang, W.G., Archibald, K.M., Hirzel, A.J., Smith, W.O. Jr, Sosik, H.M., Stanley, R.H.F and D.J. McGillicuddy Jr (2022). Ephemeral surface chlorophyll enhancement at the New England shelf break driven by Ekman restratification. Journal of Geophysical Research: Oceans, 127, e2021JC017715. https://doi.org/10.1029/2021JC017715.
Read MorepH and pCO2 Time Series from the Endurance Array
Adapted and condensed by OOI from Dever et al., 2022, and Fassbender et al., 2018 doi://10.5194/essd-10-1367-2018.
The Ocean Observatories Initiative (OOI) Endurance Array makes extensive measurements of collocated physical and biogeochemical parameters throughout the water column. At the recent Ocean Sciences meeting, we reported on moored measurements from 2015 to the present off Washington and Oregon. We focused on spatial and temporal variability of pH and pCO2 and compared the measurements to published values in the region. This information was also presented in a seminar at UC, Santa Cruz on 14 Jan 2022.
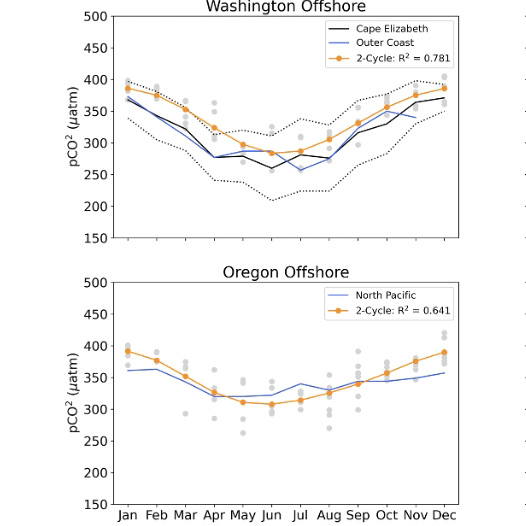
[media-caption path="/wp-content/uploads/2022/04/Endurance-highlight.png" link="#"]OOI (blue, orange) mooring seasonal cycles and monthly averages (gray) for pCO2. For context, OOI mooring cycles are plotted together with Fassbender et al. (2018) (black) regional seasonal cycles. WA moorings are compared with the Fassbender et al. Outer Coast (OC) region. OR moorings are compared with the Fassbender et al. North Pacific (NP) region.[/media-caption]
The quality-controlled biogeochemical time series are self-consistent and in line with other regional measurements. For example, pH and pCO2 have significant onshore-offshore variation and along-shelf differences north and south of the Columbia River. This variability is related to the Columbia River plume, the strength of local upwelling, and mixing with offshore waters. On a seasonal scale, pH and pCO2 is also driven by summer upwelling and winter river inputs. Variability is highest in spring and summer. pCO2 values greatly exceed atmospheric values (~400 μatm) at times in the summer (Figure above). The highest monthly pCO2 averages are seen at the Oregon shelf site.
Dever et al. (2022), pH and pC02 Time Series from the Ocean Observatories Initiative Endurance Array, CBP05, presented at Ocean Sciences Meeting 2022, Honolulu, HI (virtual), 01 Mar 2022.
Fassbender et al. (2018), Earth Syst. Sci. Data, 10, 1367–1401, 2018 https://doi.org/10.5194/essd-10-1367-2018.
Read More