
Science Highlights
Visions’22: Changing Students Lives
From Deb Kelley, UW, in OOI Quarterly Report, 2022.
This year, 25 undergraduate students and three graduate students participated on the Regional Cabled Array Operations and Maintenance cruise as part of the VISIONS’22 at-sea experiential learning program. They include students from the US, India, Saudi Arabia, France, and Kazakhstan. They represent a breadth of disciplines spanning Oceanography (11), Engineering (9: Mechanical, Industrial, Bioengineering, Environmental, and Aeronautics and Astronautics), Biology (6: Biology, Marine Biology, and Microbiology), Geology (1), and Policy Studies focused on the United Nations Convention (1). They stood 4 hour-on, 8 hour-off watches in the remotely controlled vehicle, ROPOS control center, learned how to conduct CTD casts and collect and process fluid samples, and worked on deck. Three additional undergraduate student ambassadors, who have participated in past VISIONS’ expeditions (1-3 years), helped mentor the students. All completed cruise blogs on the Interactiveoceans VISIONS’22 Expedition site, and science-engineering and/or engagement projects that will last a quarter to several years. Two students chose projects involving advanced genetic analyses of vent animals and protists for their Senior Thesis in Oceanography. Based on discussions with past students and what they relayed in their blogs, for many this is a life changing experience. Note: two past VISIONS students are now APL engineers as part of the RCA team.
Read More
Chlorophyll Enhancement at the Shelfbreak
Adapted and condensed by OOI from Oliver et al., 2022, doi:/10.1029/2021JC017715.
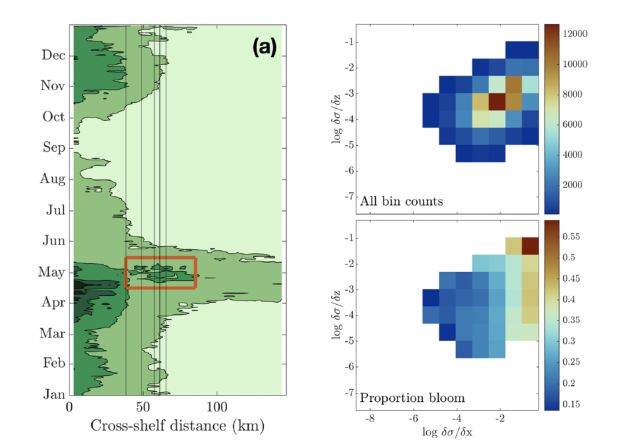
[media-caption path="/wp-content/uploads/2022/08/Screen-Shot-2022-08-18-at-3.10.51-PM.png" link="#"](left) Eighteen-year composite annual cycle of surface chlorophyll concentration from MODIS satellite. Vertical lines indicate the shelfbfreak region (depths 75 to 1,000 m); red box highlights chlorophyll enhancement at the shelfbreak. (right; upper) OOI glider data with more than 100 chlorophyll observations within horizontal and vertical density gradient bins and (lower) proportion of bins with chlorophyll > 2 mg/L, indicating a bloom. From Oliver et al., 2022.[/media-caption]The enhancement of chlorophyll due to phytoplankton blooms is recognized to occur near the frontal boundary of the New England Shelf, but the blooms are ephemeral and not consistently found in satellite remote sensing of ocean color. In a recent study, Oliver et al., (2021) show that enhanced surface chlorophyll concentrations at the shelfbreak are short lived events, and are associated with periods when a surface layer of lighter shelf water moves over denser slope water at the shelfbreak front. Both data and a computational model show that eastward, upwelling-favorable winds are the primary driver of the frontal restratification and localized enhanced surface chlorophyll.
The study used a variety of data sources, including MODIS satellite chlorophyll estimates, shipboard CTD casts from a Shelf-break Productivity Interdisciplinary Research Operation at the Pioneer Array (SPIROPA) cruise and a Pioneer mooring turn cruise, Pioneer glider density and chlorophyll, and atmospheric reanalysis winds after comparison with Pioneer surface mooring winds. A two-dimensional configuration of the Regional Ocean Model System (ROMS) coupled to a nitrogen-phytoplankton-zooplankton-detritus (NPZD) model was used to simulate the wind-driven response.
The eighteen-year time-evolution of the cross-shelf distribution of surface chlorophyll concentration from MODIS showed that shelf-break chlorophyll enhancements were evident in most years, followed an inshore spring bloom in April, and were typically seen during a short period in the spring (mid-April – mid-May; Figure above). For individual years, the shelf-break chlorophyll enhancements were short-lived, typically lasting less than a week. Pioneer Array glider data were used to explore the relationship between enhanced chlorophyll concentrations and both horizontal (assumed to be associated with the shelfbreak front) and vertical density gradients. Near surface (upper 30 m) chlorophyll concentrations were collected in log-transformed density gradient bins and then displayed according to the proportion of bins with chlorophyll > 2 mg/L, indicating a bloom. The “bloom bins” were associated with high horizontal density gradients and a range of vertical density gradients, indicating that frontal restratification is associated with enhanced chlorophyll at the shelfbreak (Figure above).
The study concludes that enhanced surface chlorophyll events at the New England shelfbreak occur consistently in the spring, but are transient, lasting only a few days to a week, and thus not discernible in seasonal climatologies. Periods of enhanced chlorophyll are associated with strong horizontal density gradients and appear to be triggered by the increase in stratification resulting from wind-driven cross-shelf advection of less dense shelf water over denser slope water. This process creates a shallow mixed layer at the front which alleviates light limitation and supports transient surface enhancements of chlorophyll.
Oliver, H., Zhang, W.G., Archibald, K.M., Hirzel, A.J., Smith, W.O. Jr, Sosik, H.M., Stanley, R.H.F and D.J. McGillicuddy Jr (2022). Ephemeral surface chlorophyll enhancement at the New England shelf break driven by Ekman restratification. Journal of Geophysical Research: Oceans, 127, e2021JC017715. https://doi.org/10.1029/2021JC017715.
Read MorepH and pCO2 Time Series from the Endurance Array
Adapted and condensed by OOI from Dever et al., 2022, and Fassbender et al., 2018 doi://10.5194/essd-10-1367-2018.
The Ocean Observatories Initiative (OOI) Endurance Array makes extensive measurements of collocated physical and biogeochemical parameters throughout the water column. At the recent Ocean Sciences meeting, we reported on moored measurements from 2015 to the present off Washington and Oregon. We focused on spatial and temporal variability of pH and pCO2 and compared the measurements to published values in the region. This information was also presented in a seminar at UC, Santa Cruz on 14 Jan 2022.
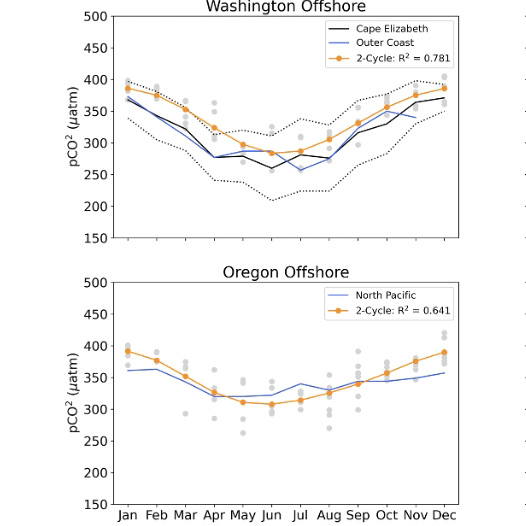
[media-caption path="/wp-content/uploads/2022/04/Endurance-highlight.png" link="#"]OOI (blue, orange) mooring seasonal cycles and monthly averages (gray) for pCO2. For context, OOI mooring cycles are plotted together with Fassbender et al. (2018) (black) regional seasonal cycles. WA moorings are compared with the Fassbender et al. Outer Coast (OC) region. OR moorings are compared with the Fassbender et al. North Pacific (NP) region.[/media-caption]
The quality-controlled biogeochemical time series are self-consistent and in line with other regional measurements. For example, pH and pCO2 have significant onshore-offshore variation and along-shelf differences north and south of the Columbia River. This variability is related to the Columbia River plume, the strength of local upwelling, and mixing with offshore waters. On a seasonal scale, pH and pCO2 is also driven by summer upwelling and winter river inputs. Variability is highest in spring and summer. pCO2 values greatly exceed atmospheric values (~400 μatm) at times in the summer (Figure above). The highest monthly pCO2 averages are seen at the Oregon shelf site.
Dever et al. (2022), pH and pC02 Time Series from the Ocean Observatories Initiative Endurance Array, CBP05, presented at Ocean Sciences Meeting 2022, Honolulu, HI (virtual), 01 Mar 2022.
Fassbender et al. (2018), Earth Syst. Sci. Data, 10, 1367–1401, 2018 https://doi.org/10.5194/essd-10-1367-2018.
Read More
Atlantic Water Influence on Glacier Retreat
Adapted and condensed by OOI from Snow et al., 2021, doi:/10.1029/2020JC016509
The warming of Atlantic Water along Greenland’s southeast coast has been considered a potential driver of glacier retreat in recent decades. In particular, changes in Atlantic Water circulation may be related to periods of more rapid glacier retreat. Further investigation requires an understanding of the regional circulation. The nearshore East Greenland Coastal Current and the Irminger Current over the continental slope are relatively well studied, but their interactions with circulation further offshore are not clear, in part due to relatively sparse observations prior to establishing the OOI Irminger Sea Array and the Overturning in the Subpolar North Atlantic Program (OSNAP).
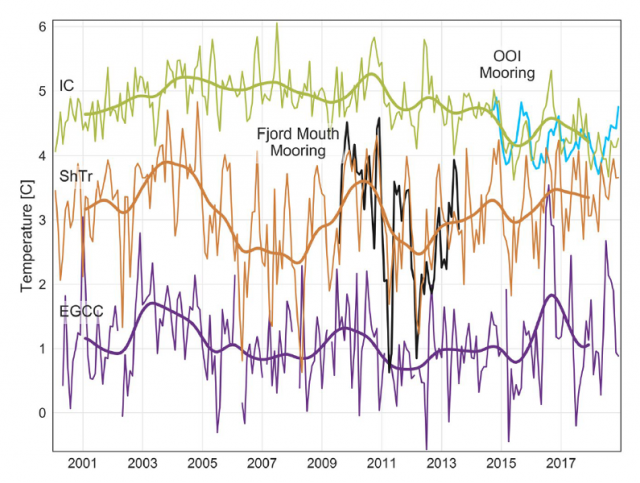
[media-caption path="/wp-content/uploads/2022/04/Pioneer-highlight.png" link="#"]Satellite-derived sea surface temperature after adjustment for the Irminger Current (IC; green), Shelf Trough (ShTr; orange), and East Greenland Coastal Current (EGCC; purple). Monthly values (thin lines) are shown for 2000-2018 with 24-month low-passed records overlain. In situ observations from the fjord mouth (290 m: Black) and OOI flanking mooring FLMA (180 m; blue) are shown for comparison.[/media-caption]
In a recent study (Snow et al., 2021) use in-situ mooring data to validate satellite SST records and then use the 19-year satellite record to investigate relationships between glacier melt and Atlantic Water variability. In order to use the satellite records for this purpose, several adjustments must be made, including accounting for cloud and sea ice contamination, eliminating seasonally-varying diurnal biases, and removing the influence of air temperature. This adjusted satellite SST can be compared to in-situ mooring data during a portion of the record. A coastal mooring near the Sermilik Fjord mouth and the OOI Irminger Sea Array provide useful records during 2009-2013 and 2014-2018, respectively (Figure 24). An interesting aspect is that the temperature record from OOI Flanking Mooring A (FLMA) is useful for this purpose even though the measurements are at 180 m depth. This is because the upper ocean is relatively homogeneous in this region, and the mixed layer is deeper than 180 m during much of the year. The authors find that the adjusted satellite SST is consistent with the in-situ records on monthly to interannual time scales (Figure above). This provided the motivation to investigate relationships between the 19 year satellite record and glacier discharge rates.
The study concludes that warmer upper ocean temperatures as far offshore as the OOI Irminger Sea Array were concurrent with increased glacier retreat in the early 2000s, in support of the idea that Atlantic Water circulation plays a role. However, they also note that this influence is not direct, because of substantial variation in how Atlantic Water is diluted as it flows across the shelf towards Sermilik Fjord. The idea that time-varying dilution of Atlantic Water governs the temperature of water reaching the glacier was not previously understood, and resolving such small-scale, time-varying processes is a challenge for models. The authors conclude that with appropriate adjustments, “[satellite] SSTs show promise in application to a wide range of polar oceanography and glaciology questions” and that the method can be generalized to other glacier outflow systems in southeast Greenland to complement relatively sparse in-situ records.
Snow, T., Straneo, F., Holte, J., Grigsby, S., Abdalati, W., & Scambos, T. (2021). More than skin deep: Sea surface temperature as a means of inferring Atlantic Water variability on the southeast Greenland continental shelf near Helheim Glacier. J. Geophys. Res: Oceans, 126, e2020JC016509. https://doi.org/10.1029/2020JC016509.
Read MoreSummer 2021 Low Oxygen Event on the West Coast of North America
Adapted and condensed by OOI from Tetjana et al., 2022.
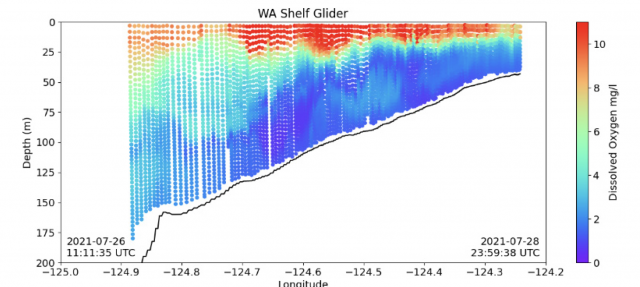
A team of researchers using OOI Coastal Endurance data reported a low oxygen event on the west coast of America. They found that while hypoxic events are known to occur seasonally in coastal bottom waters along the west coast of North America, 2021 was more severely hypoxic. The onset of low oxygen water was the earliest in 35 years (NOAA, 2021), lasted longer (Lundeberg, 2021), was anomalously low, and covered a larger extent, reaching north into Canadian waters where hypoxia is rare (Crawford and Pe.a, 2013).
[media-caption path="/wp-content/uploads/2022/04/Screen-Shot-2022-04-12-at-3.44.04-PM.png" link="#"]Dissolved oxygen measured from an underwater vehicle glider operated by Oregon State University on a cross-shore transect off Grays Harbor, Washington, USA (plots available at http://nvs.nanoos.org and data available at the U.S. Integrated Ocean Observing System Glider Data Acquisition Center, http://gliders.ioos.us ). Hypoxic water occupies the lower three-quarters of the water column near the mid-shelf mooring location (~80 m isobath) and stretches from the outer continental shelf, shoreward to at least the 50-m isobath.[/media-caption]
The paper was published in the Winter 2022 edition of Pices Press and can be reviewed here.
Initiation of a Marine Heat Wave
Adapted and condensed by OOI from Chen et al., 2022, doi:epdf/10.1029/2021JC017927.
Marine heat waves are sustained, anomalous ocean warming events with significant regional extent. In some cases, these heat waves are driven by heating from the atmosphere. In new work (Chen et al. 2022), it is shown that ocean processes can also be responsible for marine heat waves. In this case, the presence of anomalously high temperatures on the New England shelf was detected by CTD observations made by commercial fishing vessels. The fishing vessel CTD data indicated that the heat wave was a “compound event”, i.e. one with large anomalies in both temperature and salinity. Because atmospheric heating would drive only a temperature anomaly, and because the Gulf Stream derived slope water offshore of the New England shelf is high in both temperature and salinity, it was surmised that this heat wave was driven by ocean advection.
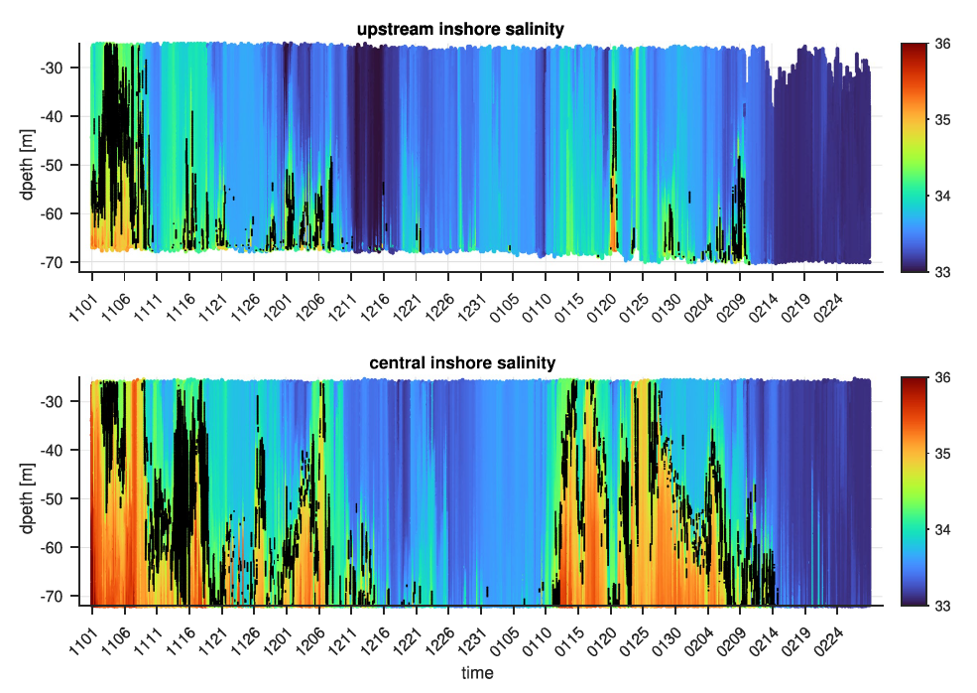
[media-caption path="/wp-content/uploads/2022/02/CGSN1.png" link="#"]Figure 23. Salinity contoured vs. depth and time for the Pioneer Upstream Inshore (PMUI) and Central Inshore (PMCI) profiler moorings from November 2016 to February 2017. The 34.5 isohaline is marked in black to highlight the boundary between the shelf and slope waters.[/media-caption]
The authors used data from Pioneer Array profiler moorings (PMUI and PMCI) to support this ocean advection hypothesis. Salinity records (Figure 23) show high salinity events in Nov/Dec 2016 and Jan 2017. The salinity anomalies are indicative of slope water (S > 34.5), are most intense at the bottom, and are more pronounced further offshore. This is consistent with a bottom intensified intrusion of warm, salty slope water onto the shelf to initiate the heat wave observed by the fishing fleet CTDs in January of 2017.
Further investigation was done to understand the cross-shelf exchange process, which presumably originated at the shelfbreak and penetrated large distances onshore as a bottom intrusion. The principal tool for the additional analysis was a new high-resolution regional model. The model was able to reproduce major features including shelf water properties, the shelf break front, and warm-core rings in the slope sea . Critically, the model showed the presence of cyclonic eddies (opposite in rotation, thinner and smaller than the warm core rings) that were responsible for driving cross-shelf flow and intensifying the front. The authors argue that these processes precondition the outer shelf by bringing warm salty water to the shelf break, i.e. roughly the 100 m isobath.
Another step is necessary to produce the dramatic, bottom intensified intrusion of warm salty water to ~50 m depth, as seen in January 2017. Further examination of the model, including runs with and without wind forcing, indicated that persistent upwelling-favorable winds along with topographic effects were the additional ingredients necessary to cause the dramatic intrusion. Although some onshore penetration results from the standard “two-dimensional” wind-driven upwelling, the authors found that details of the three-dimensional regional topography were critical to extensive slope water penetration in the form of a warm, salty, bottom-intensified tongue.
Identifying the unusually strong intrusion and finding the hints to a slope-sea origin shows the importance of sustained observing, in this case from both the Pioneer Array and the fishing fleet.
Unraveling this remarkable, multi-step process, with pre-conditioning by small-scale cyclonic eddies followed by a topographically-controlled, wind driven response, is a testament to the power of high-resolution models to fill in dynamical gaps in the observing systems. The authors note that “this study provides dynamical explanations of the observed water mass anomalies across the shelf, offers new insights about cross-shelf exchange… and lays the ground work for future studies.”
__________________________________________________________________
Chen, K., Gawarkiewicz, G., & Yang, J. (2022). Mesoscale and submesoscale shelf-ocean exchanges initialize an advective Marine Heatwave. Journal of Geophysical Research: Oceans, 127, doi:epdf/10.1029/2021JC017927.
Read MoreAxial Seamount Continues to Reveal Its Secrets
Adapted and condensed by OOI from Chadwick et al., 2022, doi:/10.1029/2021GC010153.
Axial Seamount is the longest monitored mid-ocean ridge volcano, providing new insights into the relationships among magma supply, uplift-deflation behavior, and seismicity leading to and follow eruptions. Results are as summarized here.
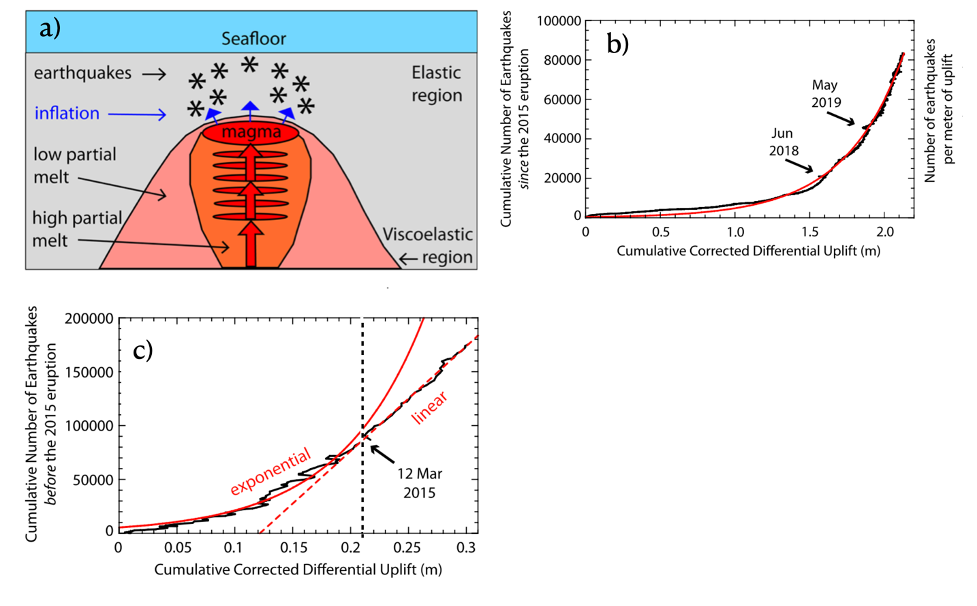
[media-caption path="/wp-content/uploads/2022/02/Axial.png" link="#"]a) Cross section cartoon showing shallow magma chamber beneath Axial fed by a series of stacked sills. Upward migrating of melt through the sills results increases pressure in the shallow chamber causing uplift and associated earthquakes. b) Exponential increase in earthquakes per meter of uplift since the 2015 eruption. c) Earthquakes per meter of uplift before March 12, 2015 follow an exponential increase, while post this day earthquakes follow a linear trend leading up to the April 24, 2015 eruption. (After Chadwick et al., 2022; Figures 6 and 13).[/media-caption]The magma supply rate has changed significantly over periods of months to years. Since the 2015 eruption, the summit of the volcano has been inflating at a decreasing rate. This re-inflation was punctuated by eight discrete short-term deflation events occurring over 1-3 weeks, approximately every 4-6 months from August 2016 to May 2019. These deflation events were coincident with an abrupt decrease in seismic activity, which did not pick up until reinflation resumed. In contrast, the long-term monitoring indicates that there was a surge in magma supply between 2011 and 2015, resulting in the two eruptions closely spaced in time.
Although the summit of the volcano has inflated 85%-90% of its pre 2015 eruption level, the geodetic and seismic monitoring suggests that the magma supply rate has been waning since 2015, pushing the forecast for the next eruption out 4-9 years. The data since 2015 also show that the deformation and seismic activity are tightly coupled, showing an exponential increase in seismic activity per unit of uplift. A significant conclusion from this study is that the transition from an exponential to linear increase in seismic activity to total uplift may indicate impending crustal failure between the shallow magma chamber and the seafloor. In concert, these results may lead to more refined forecasting of future eruptions of this highly active volcano and the testing of hypotheses concerning the short-term deflation events.
__________________________________________________________
Chadwick, W.W., Jr., W.S.D. Wilcock, S.L. Nooner, J.W Beeson, A.M. Sawyer, and T.-K. Lau (2022) Geodetic monitoring at Axial Seamount since its 2015 eruption reveals a waning magma supply and tightly linked rates of deformation and seismicity. Geochemistry, Geophysics, Geosystems, 23, e2021GC01053.
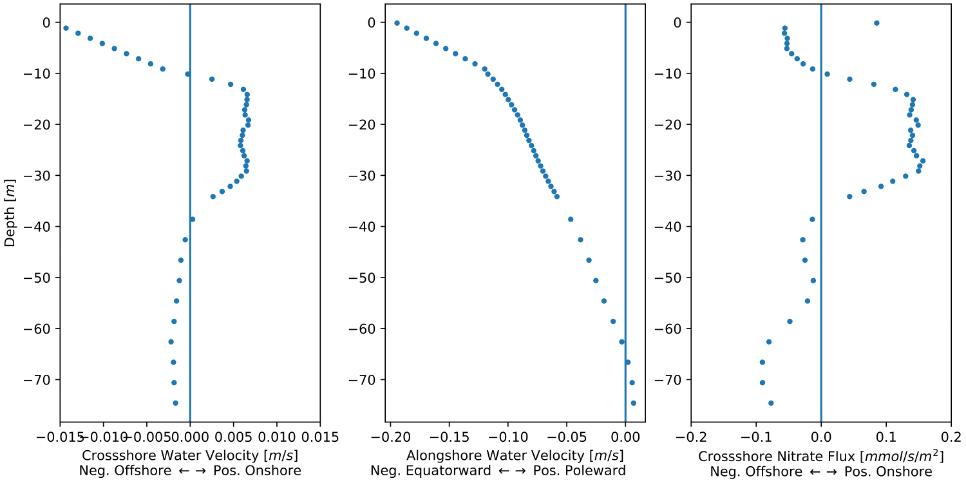
Read MoreObservations of Cross-Shelf Nitrate Fluxes over the Oregon Continental Shelf
Extracted from OOI Quarterly Report, 2022.
The US Pacific Northwest coastal ecosystems are primarily limited in growth from nitrate supply. The nitrate supply that drives the highly productive marine growth in this region is primarily a result of wind driven coastal upwelling. This work seeks to investigate cross-shelf nitrate fluxes over the continental shelf off the coast of Oregon following the installation of new nitrate and Acoustic Doppler current profilers (ADCPs) in the Ocean Observatories Initiative Coastal Endurance Array.
[media-caption path="/wp-content/uploads/2022/02/Endurance.png" link="#"]Figure 24. A velocity and nitrate profile from the shelf site at the Newport line. Data used was from the 2019 summer, approximately mid-June to early October (deployments 13, 14, and 15). The net nitrate flux found at that site over this time period, found by vertically integrating the values above, is roughly 1.16 mmol Nitrate/second/meter coastline. [/media-caption]
The primary onshore flow of nitrate-rich water over the continental shelf is found to originate at the middle depths, consistent with previous research in the region. However, the upwelling and cross-shelf nitrate fluxes on the continental shelf are found to be in poor agreement with common upwelling indices, e.g., coastal upwelling transport index (CUTI) and biologically effective upwelling transport index (BEUTI). Several factors for this disagreement are proposed, including the focus of the indices on dynamics farther offshore of the continental shelf. Observed coastal wind stress, calculated on a weekly rolling average, is found to be a potential alternative for predicting nearshore nitrate concentrations. Farther offshore at the mid-shelf, only a weak correlation between observed wind stress and observed surface transport is found, suggesting the need for additional dynamics to fully explain the observed surface transport and nitrate fluxes. Correctly modelling the nitrate supply for coastal ecosystems is essential for predicting phytoplankton blooms that are vital to the production of fisheries on the coast. Thus, understanding these limitations is of great importance for ocean-driven coastal economies.
Written by Andrew Scherer, California State University, Monterey Bay and Cleveland State University and Thomas Connolly, Moss Landing Marine Laboratories, San José State University
Andrew Scherer is an undergraduate physics student at Cleveland State University. In summer 2021, he performed this research with Prof. Tom Connolly (MLML, SJSU) as part of a National Science Foundation Research Experience for Undergraduates program and presented it at the Eastern Pacific Ocean Conference Stanford Sierra Center, Fallen Leaf Lake, California 26-29 Sep 2021.
Read MoreA Case Study for Open Data Collaboration
Recognizing that freely accessible ocean observatory data has the potential to democratize interdisciplinary science for early career researchers, Levine et al. (2020) set out to demonstrate this capability using the Ocean Observatories Initiative. Publicly available data from the OOI Pioneer Array moorings were used, and members of the OOI Early Career Scientist Community of Practice (OOI-ECS) collaborated in the study.
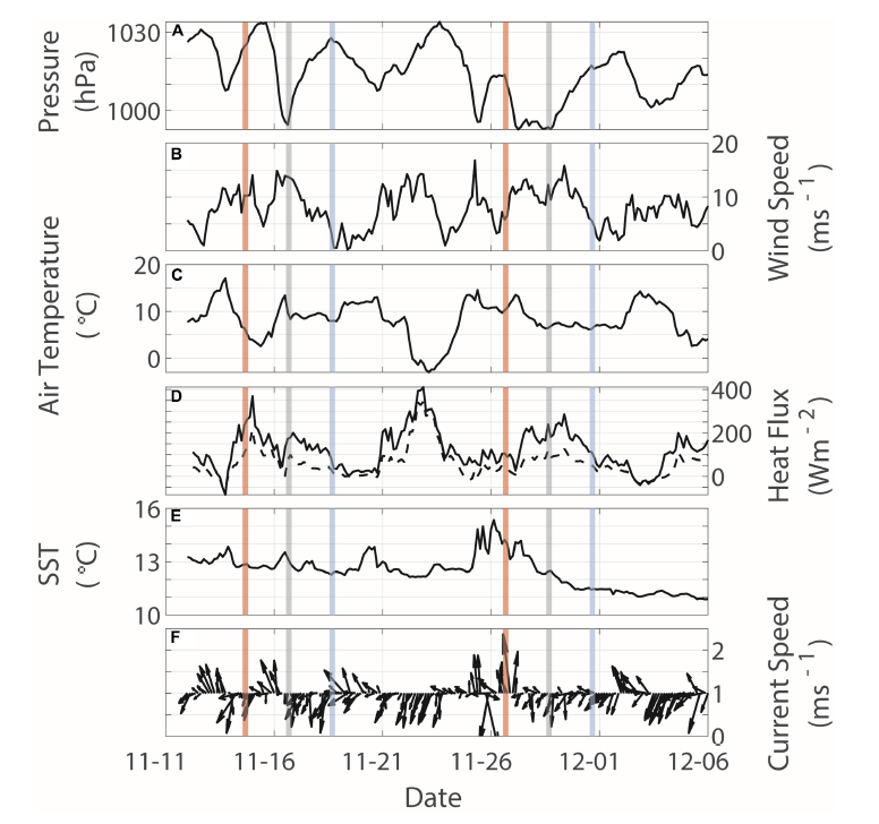
A case study was constructed to evaluate the impact of strong surface forcing events on surface and subsurface oceanographic conditions over the New England Shelf. Data from meteorological sensors on the Pioneer surface moorings, along with data from interdisciplinary sensors on the Pioneer profiler moorings, were used. Strong surface forcing was defined by anomalously low sea level pressure – less than three times the standard deviation of data from May 2015 – August 2018. Twenty-eight events were identified in the full record. Eight events in 2018 were selected for further analysis, and two of those were reported in the study (Figure 24).
[media-caption path="https://oceanobservatories.org/wp-content/uploads/2021/07/CGSN-Highlight.png" link="#"]Figure 24. Two surface forcing events (16 and 27 November) identified from the time series of surface forcing at the Pioneer Central surface mooring. Vertical lines indicate the peak of the anomalous low-pressure events (gray), as well as times 48 h before (red) and after (blue). (A) sea level pressure, (B) wind speed, (C) air temperature, (D) latent (solid) and sensible (dashed) heat fluxes, (E) sea surface temperature, and (F) surface current speed and direction. [/media-caption]The impact of surface forcing on subsurface conditions was evaluated using profile data near local noon on the day of the event, as well as 48 hr before and after (Figure 24). Subsurface data revealed a shallow (40-60 m) salinity intrusion prior to the 16 November event, which dissipated during the event, presumably by vertical mixing and concurrent with increases in dissolved oxygen and decreases in colored dissolved organic matter (CDOM). At the onset of the 27 November event, nearly constant temperature, salinity, dissolved oxygen and CDOM to depths of 60 m were seen, suggesting strong vertical mixing. Data from multiple moorings allowed the investigators to determine that the response to the first event was spatially variable, with indications of slope water of Gulf Stream origin impinging on the shelf. The response to the second event was more spatially-uniform, and was influenced by the advection of colder, fresher and more oxygenated water from the north.
The authors note that the case study shows the potential to address various interdisciplinary oceanographic processes, including across- and along- shelf dynamics, biochemical interactions, and air-sea interactions resulting from strong storms. They also note that long-term coastal datasets with multidisciplinary observations are relatively few, so that the Pioneer Array data allows hypothesis-driven research into topics such as the climatology of the shelfbreak region, seasonal variability of Gulf Stream meanders and warm-core rings, the influence of extreme events on shelf biogeochemical response, and the influence of a warming climate on shelf exchange.
In the context of the OOI-ECS, the authors note that the study was successfully completed using open-source data across institutional and geographic boundaries, within a resource-limited environment. Interpretation of results required multiple subject matter experts in different disciplines, and the OOI-ECS was seen as well-suited to “team science” using an integrative, collaborative and interdisciplinary approach.
______________________________________________________________________________________________
Levine, RM, KE Fogaren, JE Rudzin, CJ Russoniello, DC Soule, and JM Whitaker (2020) Open Data, Collaborative Working Platforms, and Interdisciplinary Collaboration: Building an Early Career Scientist Community of Practice to Leverage Ocean Observatories Initiative Data to Address Critical Questions in Marine Science. Front. Mar. Sci. 7:593512. doi: 10.3389/fmars.2020.593512.
Read MoreBottom Boundary Layer O2 Fluxes During Winter on the Oregon Shelf
Adapted and condensed by OOI from Reimers et al., 2022, doi:/10.1029/2020JC016828.
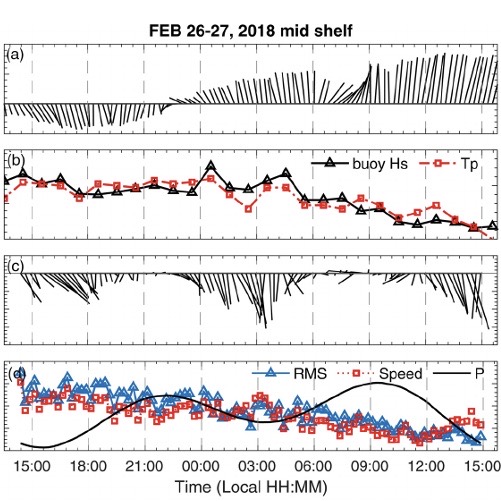
[caption id="attachment_21037" align="aligncenter" width="640"]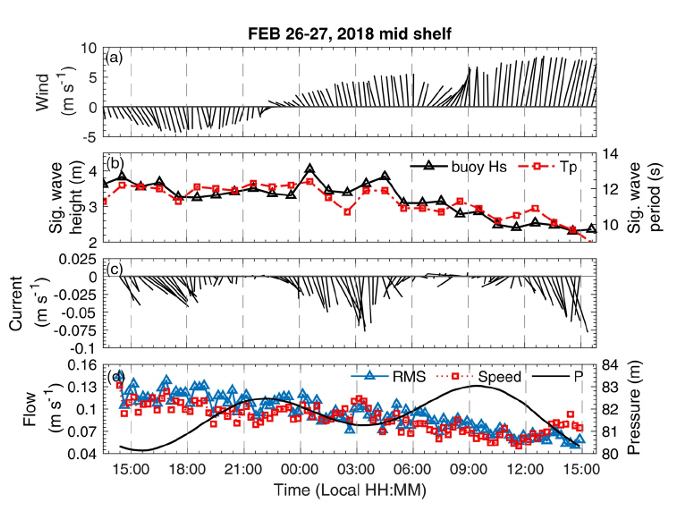 Fig. 1 Time series of physical conditions during the February 26–27, 2018 deployment (EC D1) at the mid-shelf site. (a) Wind vectors (15-min averages) measured at the OOI Shelf Surface Mooring (CE02SHSM), (b) wave properties (hourly averages) measured at the OOI Shelf Surface Mooring, (c and d) other near-bottom ADV parameters (15-min averages). Both the winds and ADV velocities are portrayed in earth coordinates (eastward is to the right along the horizontal axis and northward is positive along the vertical axis). ADV, Acoustic Doppler Velocimeter; EC D, eddy covariance deployment[/caption]
The oceanic bottom boundary layer (BBL) is the portion of the water column close to the seafloor where water motions and properties are influenced significantly by the seabed. This study (Reimers & Fogaren, 2021) reported in the Journal of Geophysical Research examines conditions in the BBL in winter on the Oregon shelf. Dynamic rates of sediment oxygen consumption (explicitly oxygen fluxes) are derived from high-frequency, near-seafloor measurements made at water depths of 30 and 80 meters. The strong back-and-forth motions of waves, which in winter form sand ripples, pump oxygen into surface sediments, and contribute to the generation of turbulence in the BBL, were found to have primed the seabed for higher oxygen uptake rates than observed previously in summer.
Since oxygen is used primarily in biological reactions that also consume organic matter, the winter rates of oxygen utilization indicate that sources of organic matter are retained in, or introduced to, the BBL throughout the year. These findings counter former descriptions of this ecosystem as one where organic matter is largely transported off the shelf during winter. This new understanding highlights the importance of adding variable rates of local seafloor oxygen consumption and organic carbon retention, with circulation and stratification conditions, into model predictions of the seasonal cycle of oxygen.
Supporting observations, which give environmental context for the benthic eddy covariance (EC) oxygen flux measurements, include data from instruments contained in OOI’s Endurance Array Benthic Experiment Package and Shelf Surface Moorings. Specifically, velocity profile time-series are drawn from records of a 300-kHz Velocity Profiler (Teledyne RDI-Workhorse Monitor), near-seabed water properties from CTD (SBE 16plusV2) and oxygen (Aanderaa-Optode 4831) sensors, winds from the surface buoy’s bulk meteorological package, and surface-wave data products from a directional wave sensor (AXYS Technologies) (see e.g., Fig 1 above).
Reimers, C. E., & Fogaren, K. E. (2021). Bottom boundary layer oxygen fluxes during winter on the Oregon shelf. Journal of Geophysical Research: Oceans, 126, e2020JC016828. https://doi.org/10.1029/2020JC016828
Read More