
Buoy Wave Height Measurements Improve SAR Estimates
Excerpted from the OOI Quarterly Report, 2022.
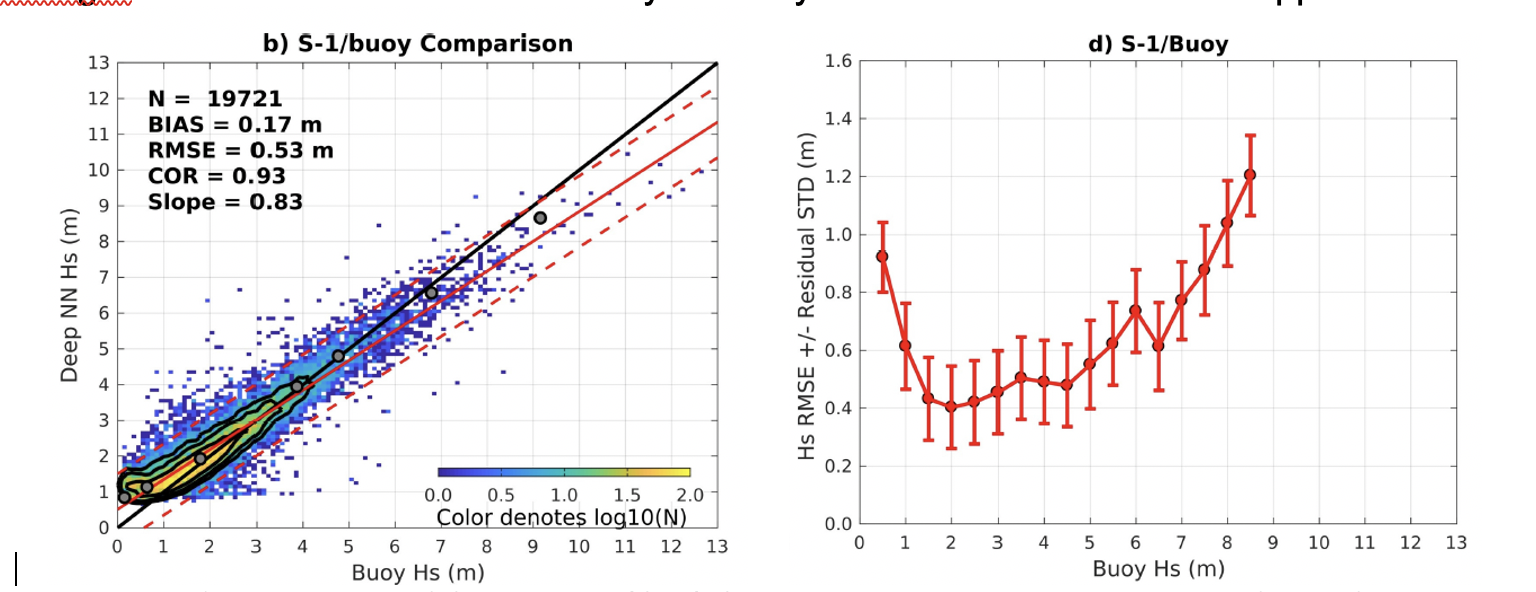
Synthetic Aperture Radar (SAR) sensors on satellites measure backscatter from the ocean surface and can be used to estimate wave height at very high spatial resolution (~10 m) relative to satellite altimetry. Two Sentinel-1 satellites of the European Space Agency (ESA) collected SAR measurements of the ocean surface from 2015-2018, together covering the entire globe every six days. Data-driven approaches to predicting significant wave height (Hs) from SAR have either used relatively limited in-situ data sets or used a wave model (e.g. WaveWatch-3) as the “training” data for a deep learning approach. Quach et al.(2020) improve on previous approaches to estimation of Hs from SAR by creating a comprehensive in-situ observational record. They compiled data from the US National Data Buoy Center and Coastal Data Information Program, Canadian Marine Environmental Data Services, the international OceanSITES project, and the OOI. Surface wave data sets from the OOI Irminger Sea, Argentine Basin and Southern Ocean surface buoys were used. The authors note the importance of the Southern Ocean Array, where “many of the largest wave heights are recorded… [from] an under sampled region of the ocean.”
The comprehensive in-situ data set is split into separate training and validation segments. When SAR Hs from training data are compared to altimeter Hs from the validation segment, the deep learning algorithm shows root-mean-square (RMS) error of 0.3 m, a 50% improvement relative to prior approaches. Comparison with the buoy validation segment (Fig. 18) shows RMS error of 0.5 m. The authors attribute the increased error to the larger number of extreme sea states in the observations and the relative paucity of extremes in the training data.
Observational sea state information is critical for understanding surface wave phenomena (generation, propagation and decay), predicting wave amplitudes, and estimating extreme sea states. Thus, the improvement in RMS error using the deep learning technique notable. The availability of in-situ data from extreme environments such as those sampled by the OOI Irminger Sea and Southern Ocean Arrays are key to validation of these new approaches.
.
Read MoreDelineating Biochemical Processes in the Northern California Upwelling System
Excerpted from the OOI Quarterly Report, 2022.
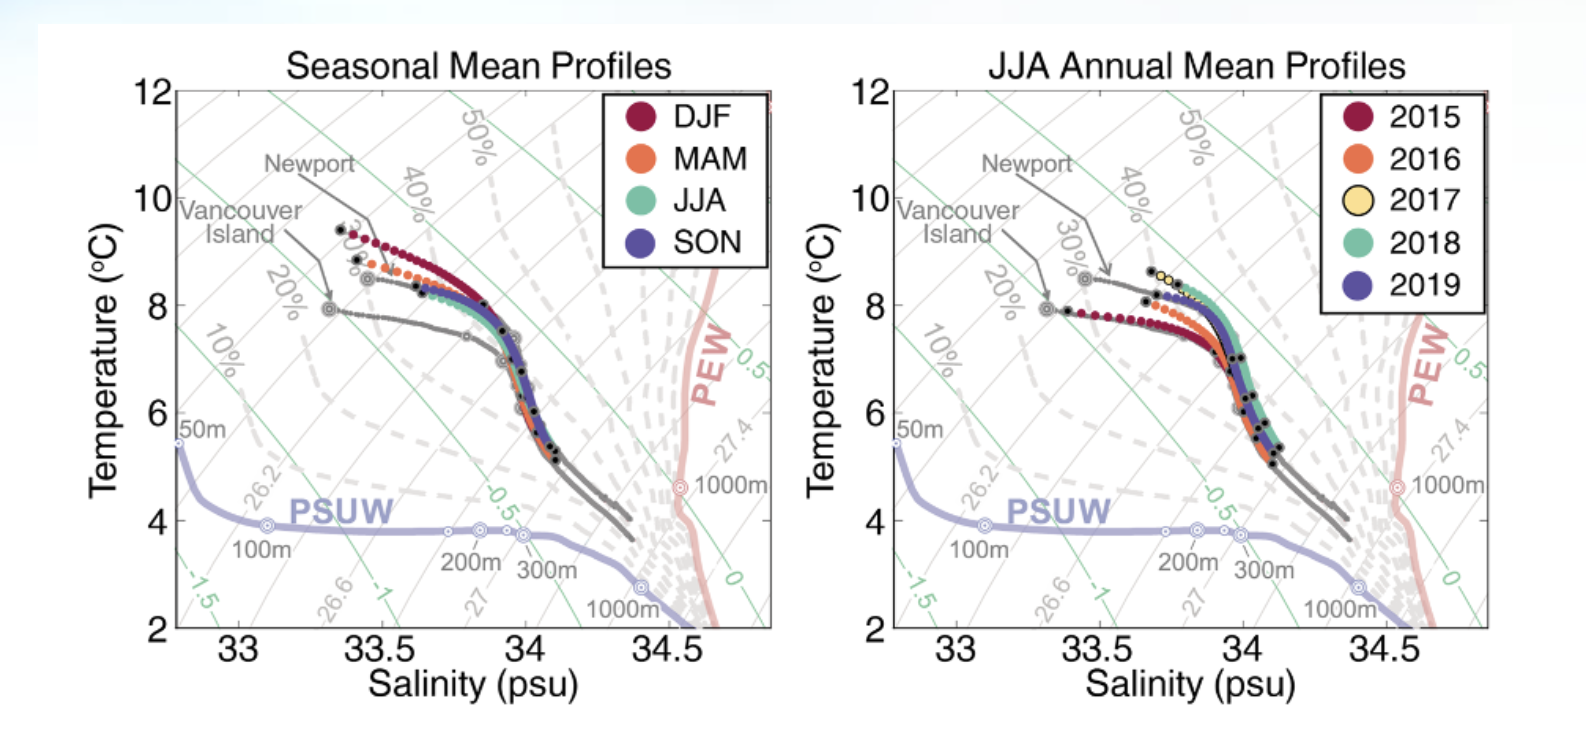
[media-caption path="/wp-content/uploads/2020/10/Endurance-Array-Science-Highlight.png" link="#"]Figure 19: Regional T/S variability at the Washington offshore profiling mooring. The end member Pacific Subarctic Upper Water (PSUW) and Pacific Equatorial Water (PEW) masses are indicated on each plot at the left and right respectively. T/S at the mooring is a mixture of PSUW and PEW. The left plot shows the seasonal variability. The right plot shows interannual variability in summer. Interannual variability from 100-250m exceeds seasonal variability. In 2015, T/S at the mooring is closer in character to climatological averages at Vancouver Island, BC while in 2018, T/S at the mooring is similar to that south of Newport, OR. Figure from Risien et al. adapted from Thomson and Krassovski (2010).[/media-caption]
Risien et al. (2020) presented over five years of observations from the OOI Washington offshore profiling mooring. First deployed in 2014, the Washington offshore profiler mooring is on the continental slope about 65 km west of Westport, WA. Its wire Following Profiler samples the water column from 30 m depth down to 500 m, ascending and descending three to four times per day. Traveling at approximately 25 cm/s, the profiler carries physical (temperature, salinity, pressure, and velocity) and biochemical (photosynthetically active radiation, chlorophyll, colored dissolved organic matter fluorescence, optical backscatter, and dissolved oxygen) sensors. The data presented included more than 12,000 profiles. These data were processed using a newly developed Matlab toolbox.
The observations resolve biochemical processes such as carbon export and dissolved oxygen variability in the deep source waters of the Northern California Upwelling System. Within the Northern California Current System, over the slope there is a large-scale north-south variation in temperature and salinity (T/S). Regional T/S variability can be understood as a mixing between warmer, more saline Pacific Equatorial Water (PEW) to the south, and fresher, colder Pacific Subarctic Upper Water (PSUW) to the north. Preliminary results show significant interannual variability of T/S water properties between 100-250 meters. In summer, interannual T/S variability is larger than the mean seasonal cycle (see Fig 19). While summer T/S variability is greatest on the interannual scale, T/S does covary on a seasonal scale with dissolved Oxygen (DO), spiciness and Particulate Organic Carbon (POC). In particular, warmer, more saline water is associated with lower DO in fall and winter.
Risien, C.M., R.A. Desiderio, L.W. Juranek, and J.P. Fram (2020), Sustained, High-Resolution Profiler Observations from the Washington Continental Slope , Abstract [IS43A-05] presented at Ocean Sciences Meeting 2020, San Diego, CA, 17-21 Feb.
Thomson, R. E., and Krassovski, M. V. (2010), Poleward reach of the California Undercurrent extension, J. Geophys. Res., 115, C09027, doi:10.1029/2010JC006280.
Read More
Irminger Sea Intermediate Water Formation and Transport
Adapted and condensed by OOI from Le Bras et al., 2020, doi:/10.1029/2019GL085989.
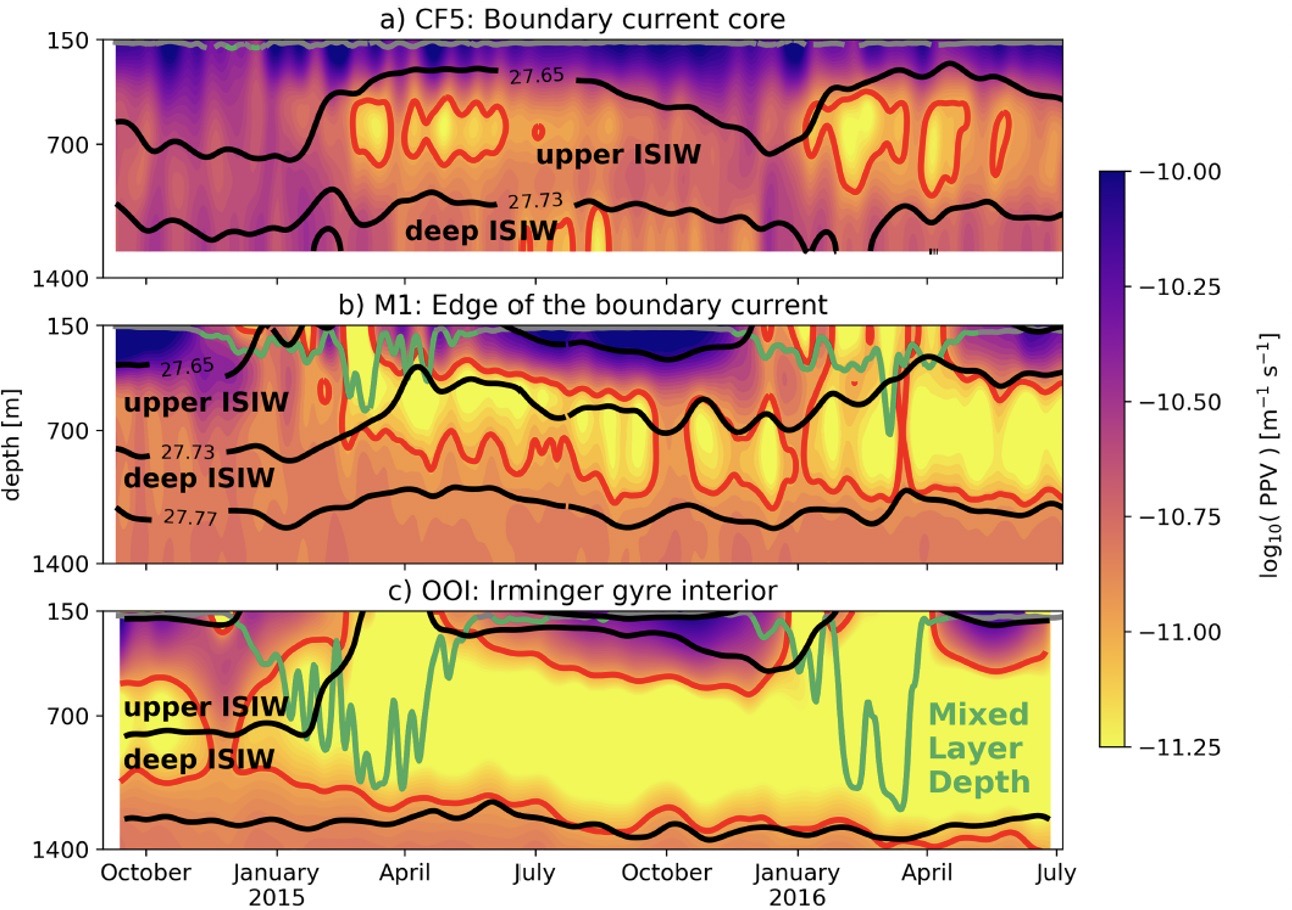
[caption id="attachment_18947" align="aligncenter" width="640"] Figure 19. Planetary potential vorticity (PPV) at (a) OSNAP mooring CF5, within the Irminger Sea boundary current core (b) OSNAP mooring M1, at the edge of the boundary current and (c) OOI flanking mooring (FLMA) and Surface Mooring within the Irminger Sea gyre. From Le Bras et al. (2020).[/caption]
A two-year record from moorings in the Irminger Sea allowed researchers (Le Bras et al., 2020) to investigate both deep convection and transport of water masses associated with the Atlantic overturning circulation. Using mooring data from the OOI Irminger Sea Array and the Overturning in the Subpolar North Atlantic (OSNAP) array, the authors were able to identify two types of Irminger Sea Intermediate Water (ISIW) formed by deep convection. Upper ISIW is found near the edge of the Irminger Sea western boundary current, whereas Deep ISIW is formed in the basin interior. Water masses were diagnosed using temperature-salinity properties and the planetary potential vorticity (PPV). Figure 19 shows PPV for three different locations, in the boundary current, at its edge, and in the Irminger Sea gyre. Black lines in the figure indicate the isopycnals that bound upper and deep ISIW as defined by the authors, the red contours enclose water with low PPV (indicative of convection) and the green lines indicate the mixed layer depth.
Seasonal pulses of low PPV water in the boundary current occurring below the mixed layer (Figure 19a) suggest subduction from a non-local source offshore. In contrast, low PPV water in the gyre interior is accompanied by a deep winter mixed layer and appears related to local convection. Further analysis by the authors indicates that waters formed by convection in the interior gyre are entrained into the boundary current within a few months of formation. Importantly, it appears that eddy dynamics are responsible for this transport of ventilated water from the interior to the boundary, and that the upper ISIW in the boundary current is a significant component of the Atlantic overturning circulation.
Read MoreEvent and Seasonal Scale Variability of Surface Heat and Momentum Fluxes

Excerpted from the OOI Quarterly Report, 2020.
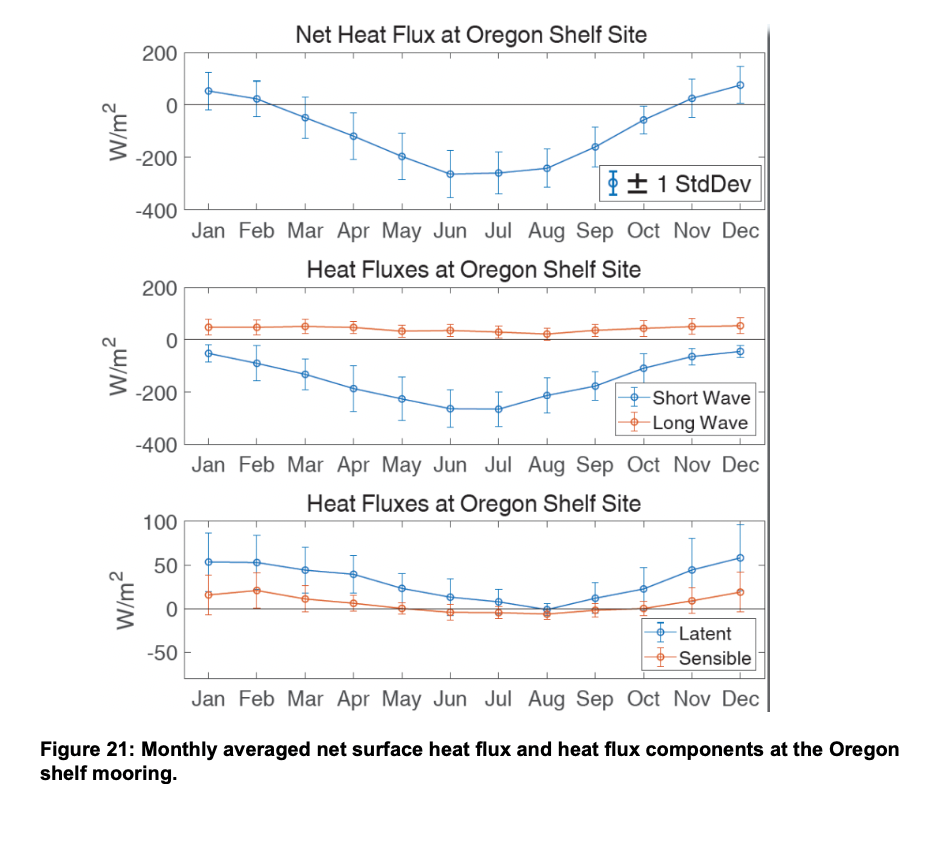
Endurance Array: Event and Seasonal Scale Variability of Surface Heat and Momentum Fluxes off Oregon and Washington
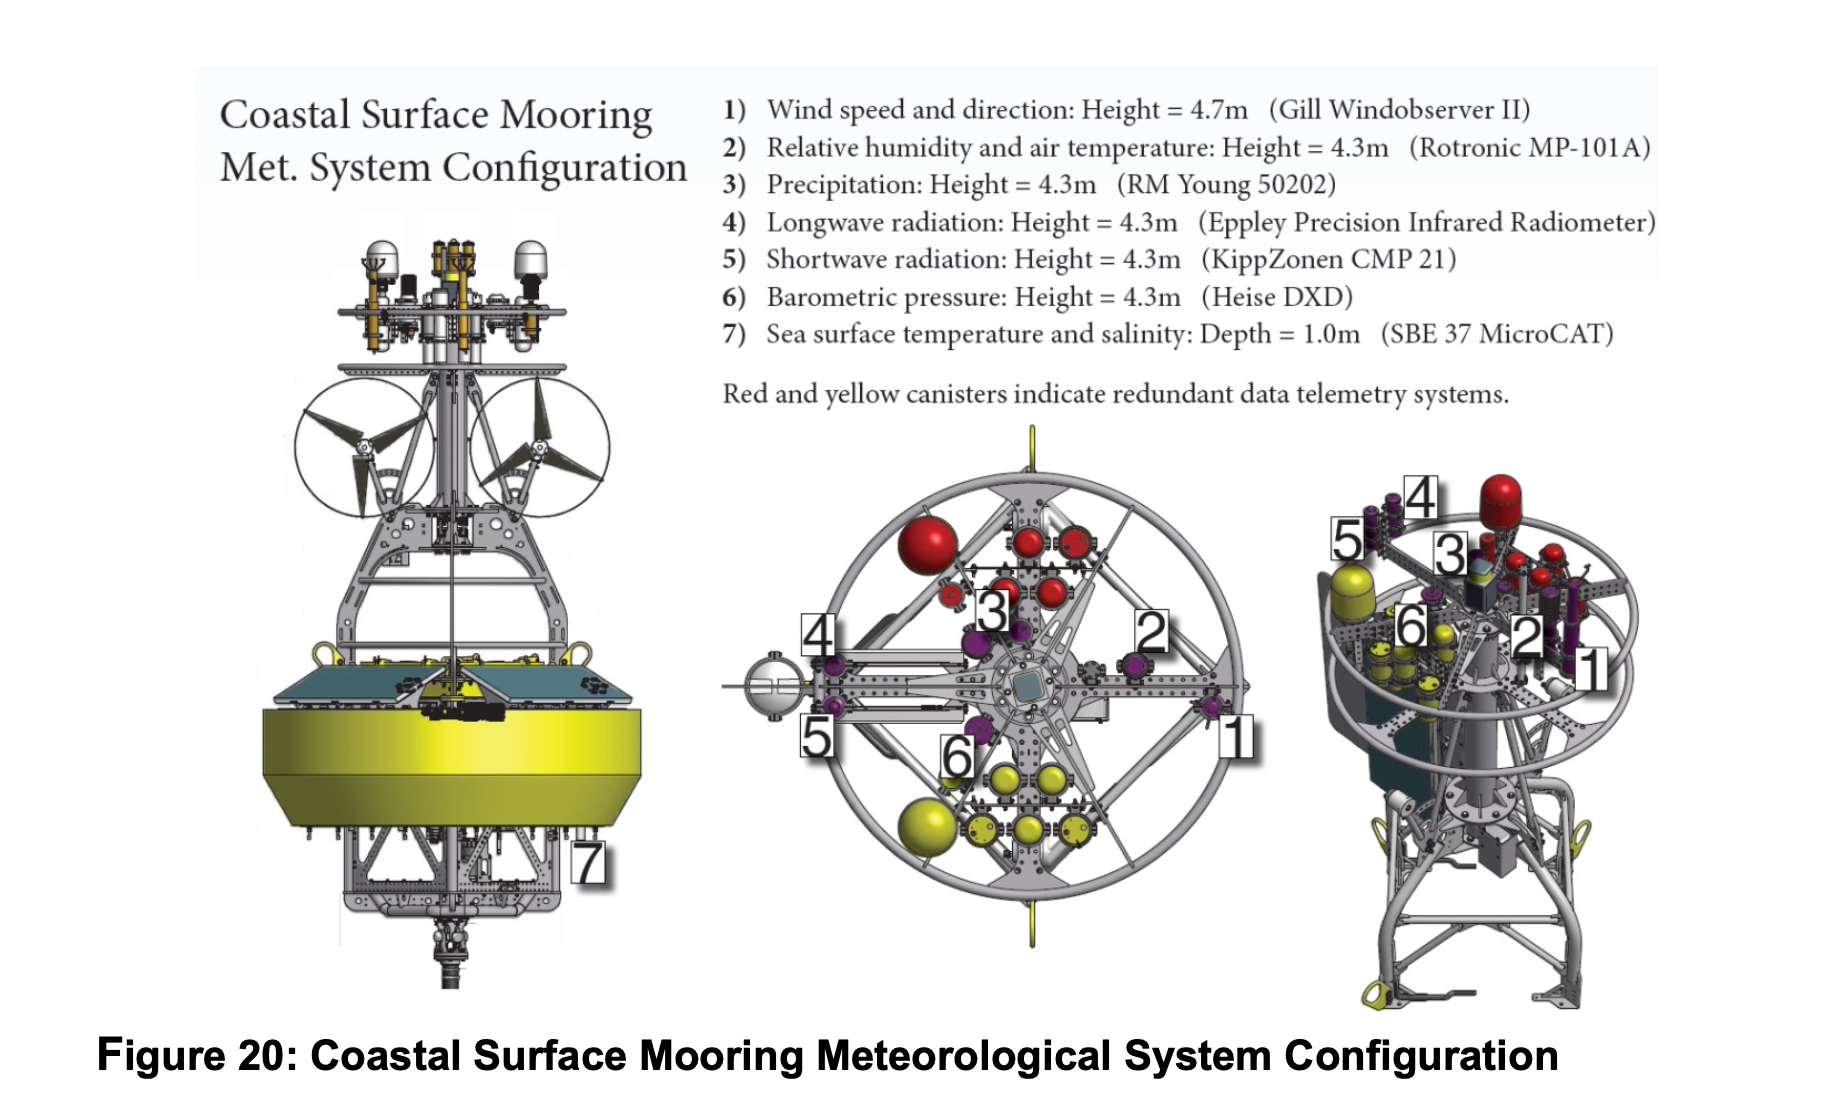
As part of the NSF-funded Ocean Observatories Initiative (OOI) Coastal and Global Scale Arrays, surface buoy meteorological measurements are made using the Air-Sea Interaction Meteorology (ASIMET) package (Figure 20). These measurements are reported on in Dever, E.P, J.P. Fram, C.M. Risien, R.A. Desiderio, C.E. Wingard (2020), Event and Seasonal Scale Variability of Surface Heat and Momentum Fluxes off Oregon and Washington, Abstract [A144A-2411] presented at Ocean Sciences Meeting 2020, San Diego, CA, 17-21 Feb. Radiative and bulk surface fluxes calculated from these measurements are provided as OOI data products. Both the measurements and the estimated fluxes are available through the OOI Data Portal as are all the metadata required to produce these fluxes (raw data, calibration coefficients, data product specifications, data product algorithms etc.).
On the Endurance Array, ASIMET measurements are made at four locations over the Oregon and Washington shelf and slope. These locations lie within the northern California Current Marine Ecosystem. Here upwelling favorable wind forcing and atmospheric conditions occur in spring and summer months with forcing in other months driven by passing low pressure systems. The timing of both the spring transition to upwelling and the fall transition to storm forcing varies from year to year as does the strength of individual events within each season. Upwelling events are associated with strong net shortwave and latent heat fluxes. Storm events are associated with weak net shortwave fluxes and latent fluxes that vary in strength.
Machine to machine (M2M) calls were used to read in hourly bulk surface fluxes from OOI Endurance Array moorings from their initial deployments in April 2015 through February 2020. OOI data product fluxes are calculated with TOGA-COARE and other community standard algorithms. Monthly averages of OOI Endurance Array flux data compare well with one another. Both the Oregon and Washington shelves are subject to heating on an annually averaged basis. The Oregon Shelf mooring (Figure 21) is typical. Late fall and winter show net fluxes from the ocean to the atmosphere. All other months show heat flux into the ocean due to insolation.
Read More
A Marine Heat Wave Identified on the New England Shelf
From Gawarkiewicz et al., 22 November 2019
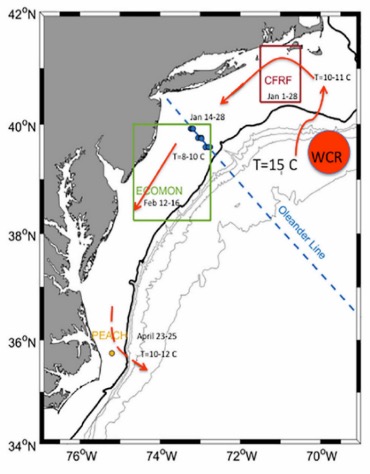
Marine heat waves are warm anomalies persisting for days to months and on spatial scales from 1-1000 km (Hobday et al., 2016). These heat waves disturb the marine environment and may have significant feedbacks on the atmosphere. Recent studies suggest that the New England continental shelf is increasingly impacted by Warm Core Rings (WCR) initiating from the Gulf Stream. Gawarkiewicz et al 2019 describe a strong marine heatwave in early 2017 that was apparently initiated by a WCR intrusion onto the shelf.
The first indication of the 2017 heatwave was from a Rhode Island fisherman who noticed unusual species (typically found in Gulf Stream waters) in his catch from the New England shelf. This indicated unusually warm waters on the shelf, and researchers began to investigate the regional extent. A number of different data sources, including OOI Pioneer Array assets, were necessary to track the anomalies along the length of the Middle Atlantic Bight (MAB).
Temperature anomalies measuring up to 6 C and salinity anomalies exceeding 1 PSU were found. The duration of the heatwave was approximately 4 months, initiating near Nantucket Shoals in Jan 2017, traversing the entire MAB, and dissipating offshore of Cape Hatteras in April. The advective path of the heatwave extended roughly 850 km.
Comparison with historical records from 1940 to 1996 showed that the 2017 heatwave was an unprecedented event in terms of temperature and salinity anomalies. The heat wave had significant impacts, including shoreward shift of the shelfbreak front, lowered chlorophyll concentrations, and the presence of warm water fish in New England coastal waters.
Read MoreTime Series Allows Investigation of Wind Forcing and Physical and Bio-Optical Variability
From Dever et al., 29 September 2019
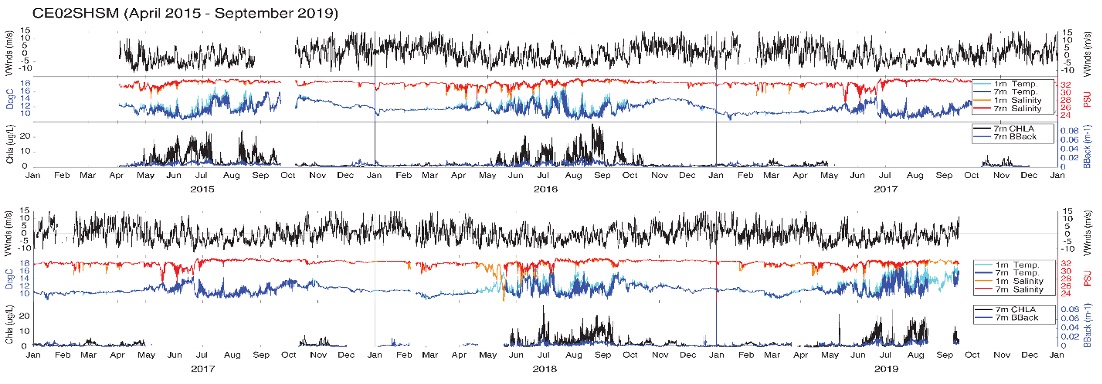
The full scope of OOI Endurance Array surface moorings has been deployed since April 2015. The moorings are deployed off Grays Harbor, Washington and Newport, Oregon at inner shelf, shelf and slope depths. They include surface meteorology, physical oceanographic, chemical and biological sensors. During the summer of 2019, EA staff reviewed mooring data since inception. In September 2019, we presented a poster of these data at the annual Eastern Pacific Ocean Conference (EPOC). The objectives of the poster were to show the time series data and discuss their availability and quality issues with research community members. To stimulate discussion, we reported on seasonal variability in wind forcing, water temperature, and chl-a fluorescence. We described the mooring measurements and how to access the data.
The Oregon and Washington shelves are part of the northern California Current Marine Ecosystem. They exhibit characteristic responses to spring and summer upwelling winds and winter storms. In the above figure, we show representative time series of near surface measurements at the Oregon shelf mooring since its start in April 2015 through the present. As part of the poster, we also presented similar data from the other OOI surface moorings and calculated lagged correlations between wind, temperature, and chlorophyll, and commented on the observed variability.
We also pointed viewers to example Matlab and Python scripts to download and plot the OOI data presented in the poster via the Machine to Machine (M2M) interface on the OOI Data Portal.
Read MoreAnomalous Shallow Strong Currents Off the Oregon Margin
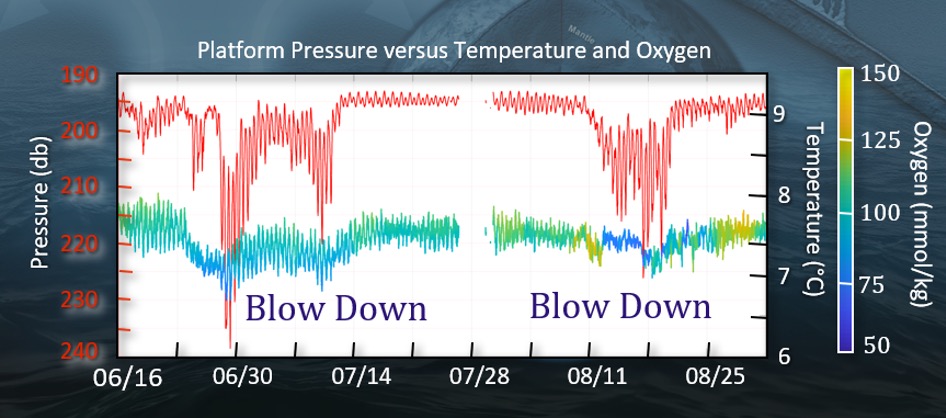
Blow down of the 200-meter Shallow Profiler Mooring Platform 2019
K. Roseburg and W. Ruef, Regional Cabled Array and P. MacCready, University of Washington, 20 August 2019
In June and August, 2019, the Slope Base Shallow Profiler Mooring was impacted by two substantial “blow down” events: these were the first observances of blow downs since the moorings were installed in 2014. The largest of these events, which occurred near the end of July and which lasted over two weeks, resulted in a deepening of the 12 ft across, 7,000 lb. platform nearly 50 m and migration of the platform ~ 150 m to the west. Results from pressure, ADCP, temperature and oxygen data pulled from CI using M2M, indicate that as the currents strengthened, the float was depressed into ~ 0.25-0.50°C cooler water with slightly decreased oxygen concentrations. An evaluation of the eddy kinetic energy calculated from the ADCP data, does not support eddy-driven water mass transport. The lower oxygen concentrations could reflect lower amounts of photosynthesis as the platforms are pushed deeper into the water column. We do not know of other documented blow down events such as these in the PNW.
Read MoreFirst Continuous Temperature Measurements Spanning >2600 m water depth

Deep temperature modulations at Axial Base
From Interactive Oceans Data Portal, 21 July 2019
Axial Base is the only site in the world’s oceans where continuous full water column measurements are being made, spanning >2600 m to ~ 5 m beneath the oceans’ surface (a & b). The Axial Base Deep Profiler (DP) Mooring has been operational for >17 months, completing two profiles a day from ~2650 m to 127 m (b). Since August 2019, DP vehicle measurements overlap with those made by instruments on the Shallow Profiler Mooring, which conducts nine profiles a day (a): since 2015, the three Shallow Profiler science pods have conducted >40,000 profiles. The high-resolution temperature measurements delineate fine scale structure both in shallow waters and below 1000 m water depth (c&d) marked by regular vertical striations . These perturbations may result from the vertical advection of the temperature field by passing semidiurnal internal tides (D. Luther, pers. com). Some modulations may be wind-driven inertial waves. Examination of dissolved oxygen concentrations during this same time period are not consistent with drawdown caused vehicle movement. Additional analyses are required, however, to unequivocally determine the processes responsible for these perturbations. A Jupyter notebook on the UW interactiveoceans data portal is now developed to analyze MODIS satellite data (chlorophyll) with measurements being made by instruments on the Shallow Profiler mooring (interactive oceans.washington.edu).
Read MoreNew Estimate of Boundary Current Transport

From Hopkins et al., 23 April 2019
Hopkins et al., 2019 use data from the OOI Irminger Sea flanking moorings to create the longest continuous record to date of Deep Western Boundary Current (DWBC) volume transport in the region. This study, part of the Overturning in the Subpolar North Atlantic Program (OSNAP), used data from two OOI flanking moorings, along with three U.S. OSNAP moorings, and five U.K. OSNAP moorings to determine the 22-month mean DWBC volume transport, and its spatial structure off Greenland (Figure above).
Determining DWBC properties is critical to understanding the transport of heat, salt, nutrients, and carbon by the Atlantic Meridional Overturning Circulation (AMOC), part of a system of currents that form the global thermohaline circulation. The combined OSNAP/OOI mooring array deployed at 60°N in the Irminger Sea during 2014 – 2015 provides the longest continuous record of DWBC volume transport at this latitude. This enables not only the most reliable estimate available of the mean transport, but the ability to investigate temporal variability.
Several key points are made by the authors. First, the average volume transport of deep water was 10.8 ± 4.9 Sv (mean ± 1 std) to the south. Of the total transport, North East Atlantic Deep Water accounted for about 6.5 Sv while about 4.1 Sv was associated with the Denmark Strait Overflow. Second, the long record allows the first systematic investigation of DWBC variability. The observed transport shows a shift from high to low frequency fluctuations with increasing distance from the East Greenland coast. High‐frequency fluctuations (2–8 days) dominate close to the continental slope, likely associated with topographic Rossby waves and/or cyclonic eddies. In deeper water, transport variance at 55 days dominates. Finally, the results indicate a modest (1.8 Sv) increase in total transport since 2005–2006, but this difference can be accounted for by a range of methodological and data limitation biases. This is of interest because although AMOC variability related to climate change is expected to be reflected in DWBC transport and properties, conclusive observational evidence of transport change has been elusive.
Read MoreStrong Variability in Irminger Sea Winter Heat Loss Measured

From Josey et al., 18 December 2018
A recent paper by Josey et al. [1] use data from the OOI Irminger Sea surface mooring to present the first characterization of multi-winter surface heat exchange at a high latitude North Atlantic site based on in-situ measurements. Heat loss in the North Atlantic is a primary determinant of how much deep water is formed in a given winter, which ultimately influences the strength of the Atlantic circulation. The Irminger Sea is a key deep convection site [2], [3], but the amount of heat lost is poorly known because winter measurements are difficult to obtain in the harsh environment [1].
Data from the first four deployments of the Irmginer surface mooring provided early winter observations in three consecutive years – 2014, 2015 and 2016. Strong variations on times scales of days to weeks are apparent in the air-sea flux components. These combine to create net heat losses exceeding 400 W/m^2 on at least one occasion each winter (Fig. 1 d).
The integrated effects of the anomalously strong heat loss events in 2014–2015 result in cumulative net heat loss significantly greater than following years (Fig. 1 e,f) This is primarily due to variations in frequency of intense short timescale (1–3 days) forcing (Fig. 1g) that would be difficult to detect without the mooring observations.
Interpreting the observations in the context of a high-resolution atmospheric model (European Centre for Medium Range Weather Forecasts Reanalysis 5) shows that the main source of multi-winter variability is changes in the frequency of Greenland tip jets that can result in hourly mean heat loss exceeding 800 W/m2 (Fig. 1g). The tip-jet events result from the mountainous Greenland terrain, which focuses winds into narrow, very strong jets over the ocean [4], [5]. Josey et al. [1] suggest how changing atmospheric circulation may influence the number of events and hence the ocean heat loss.
Improved understanding of Irminger Sea winter heat loss is likely to be critical to reliable projections of future changes in both the North Atlantic overturning circulation and climate variability.
[blockquote][1] Josey, S.A., M.F. de Jong, M. Oltmanns, G.K. Moore and R.A. Weller, 2019. Extreme variability in Irminger Sea winter heat loss revealed by ocean observatories initiative mooring and the ERA5 reanalysis, Geophys. Res. Lett., 46. https://doi.org/10.1029/ 2018GL080956
[2] de Jong, M.F. and L. de Steur, 2016. Strong winter cooling over the Irminger Sea in winter 2014–2015, Geophys. Res. Lett., 43, 106–107. https://doi.org/10.1002/2016GL069596
[3] de Jong, M.F., M. Oltmanns, J. Karstensen, and L. de Steur, 2018. Deep convection in the Irminger Sea observed with a dense mooring array. Oceanography, 31(1), 50–59. https://doi.org/10.5670/oceanog.2018.109
[4] Doyle, J.D. and M.A. Shapiro, M. A., 1999. Flow response to large-scale topography: The Greenland tip jet. Tellus A: Dynamic Meteorol. and Oceanog., 51(5), 728–748. https://doi.org/10.3402/tellusa.v51i5.14471
[5] Moore, G. W. K., & Renfrew, I. A. (2005). Tip jets and barrier winds: A QuickSCAT climatology of high wind speed events around Greenland, J. Climate, 18(18), 3713-3725, https://doi.org/10.1175/JCLI3455.1.
[/blockquote] Read More