
Posts Tagged ‘Coastal and Global Scale Nodes’
Two OOI Expeditions in Two Oceans
11th Recovery and Deployment of Global Station Papa and Irminger Sea Arrays
Two OOI Global Scale and Nodes (CGSN) teams are working simultaneously, but in different waters on opposite sides of the United States during June. The first CGSN team left Seward, Alaska aboard the R/V Sikuliaq on May 29 for a 17-day expedition to recover and re-deploy the Global Station Papa Array in the Gulf of Alaska. On June 2, a second CGSN team will depart from Woods Hole, MA to travel to the Irminger Sea Array aboard the R/V Neil Armstrong for a month-long expedition to recover and re-deploy this array.
The expeditions share similarities and differences. Both arrays are in remote locations. The Station Papa team has a 2.5-day transit to the array site in the Gulf of Alaska, while the Irminger Sea team has a longer transit of eight days to the array site. Once onsite, the teams will get to work quickly to deploy the replacement moorings to allow for overlapping measurements before recovering the moorings currently in place. This is the 11th time that each array has been turned – that is, existing ocean observing equipment at the sites will be recovered and replacement equipment will be deployed in their place. Such “turns” are needed to address biofouling of sensors, depletion of batteries, and wear and tear on equipment that has been battered by wind, waves, and weather for a year.
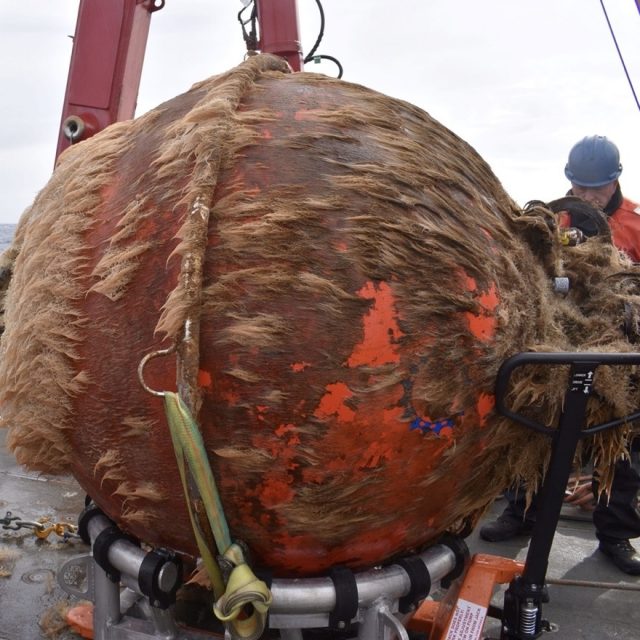
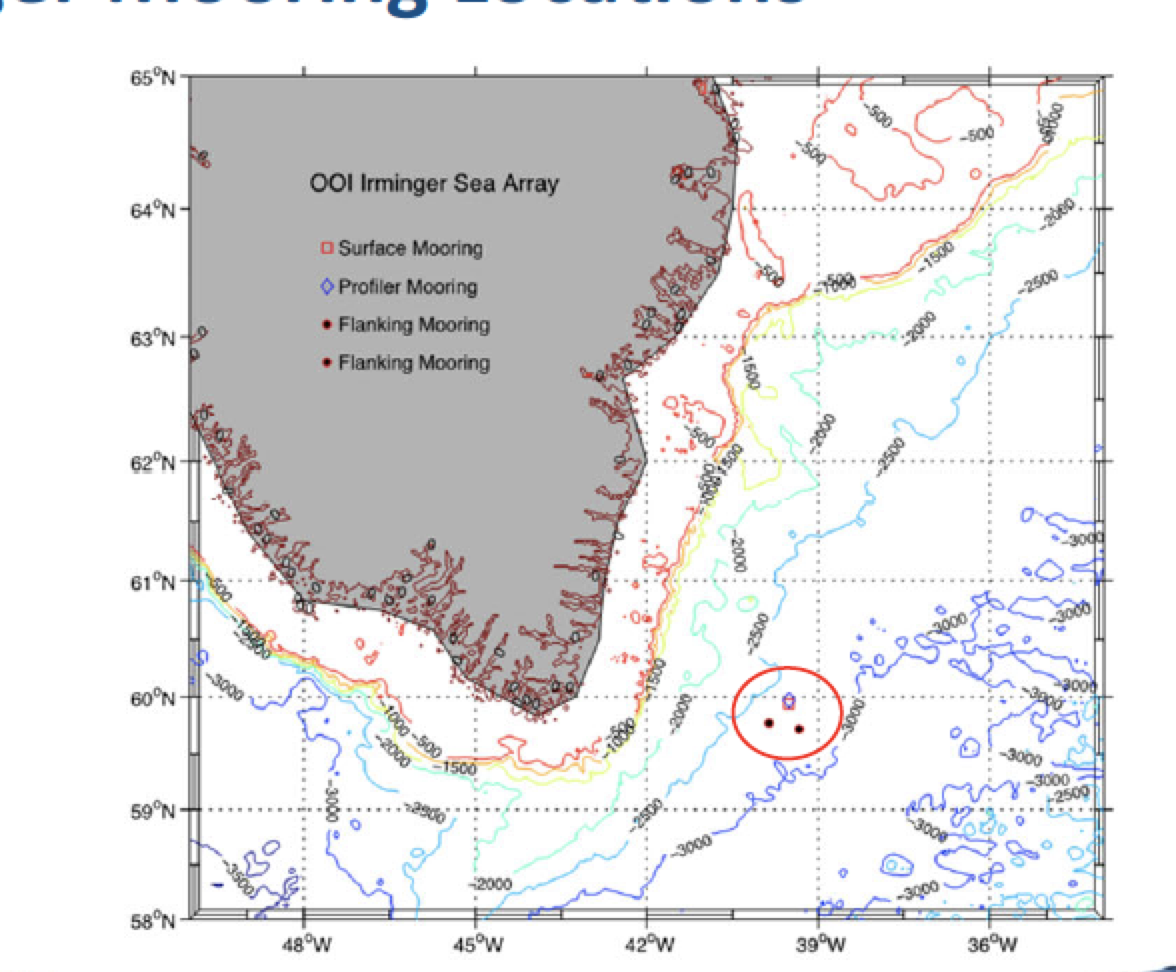
[media-caption path="https://oceanobservatories.org/wp-content/uploads/2024/05/Biofouling.jpg" link="#"]This is what one year in the ocean looks like: a Global Station Papa flanking mooring 64” sphere with 12 months of marine growth. Marine growth can inhibit the operation of the mooring and instruments and is one of the reasons we need to recover and refurbish the OOI infrastructure on a regular basis. Credit: Rebecca Travis © WHOI.[/media-caption]The Global Station Papa Array is located in the Gulf of Alaska, about 620 nautical miles offshore in a critical region of the northeast Pacific with a productive fishery subject to ocean acidification, low eddy variability, and impacted by the Pacific Decadal Oscillation. The Global Irminger Sea Array in the North Atlantic is located in a region with high wind and large surface waves, strong atmosphere-ocean exchanges of energy and gases, carbon dioxide sequestration, high biological productivity, and an important fishery. It is one of the few places on Earth with deep-water formation that feeds the large-scale thermohaline circulation.
“Because of their remote locations, both Station Papa and the Irminger arrays provide critical ocean data that scientists are using to better understand ocean circulation patterns and help identify changes in ocean conditions,” said Sheri N. White, Chief Scientist for the Irminger 11 expedition. “These arrays are hard to get to and to maintain but the data they provide are invaluable.”
Expedition Activities
A team of 11 scientists and engineers aboard the R/V Sikuliaq departed from Seward on May 29 for a 17-day expedition. During their time at sea, they will recover and deploy three OOI subsurface moorings and two open ocean gliders. They also will recover and deploy a Waverider mooring for the University of Washington. A POGO Fellowship awardee will be onboard to gain shipboard experience as part of OOI’s collaborative efforts to provide early career scientists opportunities to help increase their knowledge and advance careers. Other onboard activities will include water sampling at the deployment sites and collection of shipboard underway data.
[media-caption path="https://oceanobservatories.org/wp-content/uploads/2024/05/Irminger-gliders.jpeg" link="#"]The OOI CGSN science team will start operations at the Irminger Array by deploying two gliders. This allows the gliders to be monitored by the pilots onshore and ensure all systems are operational while the vessel is still onsite performing mooring operations. These gliders will operate autonomously at Irminger for ~12 months. Credit: John Lund © WHOI.[/media-caption]On the east coast, a second team of 15 scientists and engineers aboard the R/V Neil Armstrong will leave Woods Hole, Massachusetts on June 2 to begin their eight-day transit to the Irminger Sea. Once onsite, the team will recover and deploy four OOI moorings, deploy two gliders, recover a third, and conduct water sampling at the deployment sites. Underway shipboard data will also be collected throughout the voyage. Four additional subsurface moorings will be “turned” for the Overturning in the Subpolar North Atlantic Project (OSNAP). Water and biogeochemical sampling will be conducted in support of both OSNAP and researchers from Boston College. A marine mammal observer from NOAA will be onboard as a continuing collaboration between NOAA and OOI.
Added White, “When planning these expeditions, we do our best to maximize use of ship time by providing berths to researchers who could benefit from direct observation and data collection in these remote locations. During the expedition to Irminger, for example, we will be joined by a graduate student and two undergraduate students from Boston College who will collect biogeochemical data, and experience what it is like to do science at sea.”
A bird’s eye view of a previous Irminger Sea Array expedition:
[embed]https://www.youtube.com/watch?v=LF6Zhmlmd0A[/embed]Daily reports will be filed from both expeditions. Bookmark this site to follow along.
Read More
OOI Data Sonification
The assumption that quantitative data can be well represented not only in charts and graphs, but by increasingly sophisticated visual displays, is often taken for granted. However, researchers, instructors, and curators of museums and science centers also recognize that even the most sophisticated visual displays are inaccessible to those with low-vision or blindness. There is also the potential for alternative data presentation methods to improve understanding of complex data for sighted individuals. With these considerations in mind, a team led by Dr. Bower (WHOI) has pursued the creation of auditory displays or “data sonifications” using multi-disciplinary U.S. National Science Foundation Ocean Observatories Initiative (OOI) data sets as the basis. The results to date from the NSF-funded data sonification project are reported in a recent publication by Smith et al. (2024).
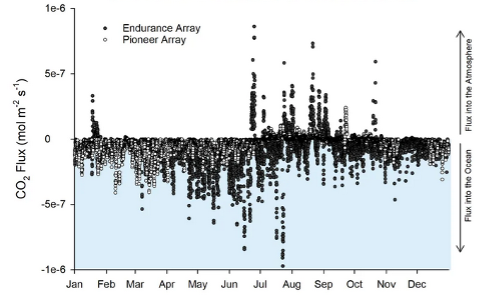
[media-caption path="https://oceanobservatories.org/wp-content/uploads/2024/05/Data-Sonification-figure.png" link="#"]Figure 1. Time series data from two data nuggets created by Ocean Data Labs that were used for sonification. Surface meteorology during the passage of hurricane Hermine over the Pioneer Array in 2016 (upper). The CO2 flux between ocean and atmosphere for both Pioneer (open circles) and Endurance Arrays during 2017 (lower).[/media-caption]Data sonification involves the mapping of quantitative data from its original form to audio signals in order to communicate complex information content. The project team was interested in using actual ocean data spanning a variety of oceanographic disciplines. Time series data produced by OOI sensors provide an excellent starting point. In particular, the Ocean Data Labs group at Rutgers has reviewed OOI data and created a set of “data nuggets” that are appropriate for sonification (Greengrove et al., 2020). The data nuggets comprise a broad range of oceanographic phenomena observed by OOI sensors, including response to a storm, the diurnal migration of zooplankton, a volcanic eruption, and the flux of CO2 between ocean and atmosphere.
The project team used a rigorous approach to developing and refining the auditory presentations. Starting with a set of learning objectives for each data nugget, a multi-step process was used to create the sonification. First, oceanographers were interviewed to establish the important points to be conveyed for a given data nugget. Next, classroom instructors were interviewed to get feedback on the most effective approaches to using sound to explain data properties. A sound designer then created an initial mapping of the data to sound, which was reviewed by a representative group of researchers, instructors, and blind and visually impaired listeners. After additional rounds of refinement and feedback, the prototype sonifications are now available. Two auditory displays utilizing Pioneer Array data (Fig. 1) are available at https://doi.org/10.5281/zenodo.8162769 and https://doi.org/10.5281/zenodo.8173880 for CO2 flux and storm response, respectively. Other examples can be found in Smith et al. (2024). The sonifications will be evaluated broadly using an on-line survey and by a “live audience” at museums and science centers.
This project is unique in exploiting the rich OOI data set and making ocean science highlights available to a broad community of students and the general public. A significant aspect of the work, as pointed out by the authors, is the systematic and inclusive approach used to develop the data sonifications. Results of the museum testing phase in 2024 will be awaited with great anticipation.
___________________
References:
Greengrove, C., S. Lichtenwalner, H.I. Palevsky, A. Pfeiffer-Herbert, S. Severmann, D. Soule, S. Murphy, L.M. Smith and K. Yarincik, 2020. Using authenticated data from NSF’s Ocean Observatories Initiative in undergraduate teaching, Oceanography, 33(1), 62-73.
Smith, L.M., A. Bower, J. Roberts, J. Bellona and J. Li, 2024. Expanding access to ocean science through inclusively designed data sonifications, Oceanography, 36(4), 96-101.
Read More
AUV Data Available in a Variety of Formats
We recently announced and demonstrated new access to autonomous underwater vehicle (AUV) data through OOI’s Data Explorer. Since the initial announcement, more has been done to provide additional AUV data and improve data delivery. As part of OOI’s efforts towards Findable, Accessible, Interoperable, and Reusable (FAIR) data, not only are AUV data easier to find and access, we now are providing these data in more interoperable and reusable formats.
When you view an AUV Deployment in Data Explorer (FIG 1), data in different formats may be accessed either through the Metadata link in the left panel (FIG 1 A) or the Downloads button (FIG 1 B). The Downloads button provides access to data products, in formats including comma separated variable (CSV), that are derived from Network Common Data Form (NetCDF) files in the OOI Raw Data Repository. To access these NetCDF files, open the Metadata link, navigate into that deployment’s folder, and then into its PROFILES subfolder. Note that each deployment’s folder also contains raw data as collected by the vehicle and an EXPORTED subfolder for data products in Matlab format.
[media-caption path="https://oceanobservatories.org/wp-content/uploads/2024/01/AUV_OOI_newsletter_Fig1_portrait.png" link="#"]Fig. 1 AUV Deployment in Data Explorer. Inset A: Metadata link to Raw Data Repository to access NetCDF format per deployment in PROFILES subfolder. Inset B: Downloads button provides data products in multiple formats. Credits: Screen grab from Data Explorer (https://dataexplorer.oceanobservatories.org/#platform/c646022c-ce04-5be8-8cd8-117da55121fa/v2?pid=14&tab=visualization) and Flaticon. Flaticon license: Free for personal and commercial use with attribution.[/media-caption]The software development effort by OOI’s Coastal & Global Scale Nodes (CGSN) Team to publish AUV data into Data Explorer involved OOI’s Cyberinfrastructure Team and Axiom Data Science. This effort builds on earlier work by OOI’s Coastal Endurance Array Team to publish glider data into the IOOS Glider DAC, and subsequently into OOI’s Data Explorer. The existing code base was integrated into a larger framework supporting the input of either glider or AUV data and supporting output formatting compatible with either or both the Glider DAC or Data Explorer.
CGSN maintains two AUV platforms, which are deployed from shipboard as part of at-sea operations in and around OOI mooring sites. The AUVs conduct ~24 hour transects, consisting of multiple profiles of the water column, before being retrieved by the ship for data collection and maintenance. CGSN AUV platforms are fitted out with a variety of instrumentation including CTD, fluorometer, and sensors for photosynthetically active radiation, dissolved oxygen, dissolved nitrate, and current measurement. When applicable, annotations are provided per deployment per instrument in OOI’s OOINet portal and M2M (Machine to Machine) interface; we plan to incorporate these annotations into NetCDF metadata and ultimately into Data Explorer.
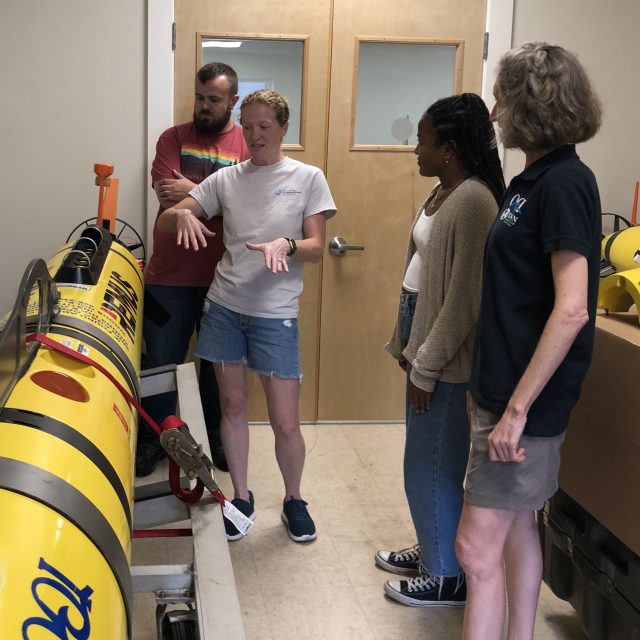
[media-caption path="https://oceanobservatories.org/wp-content/uploads/2024/01/IMG_126519-2.jpg" link="#"]CGSN Team member Diana Wickman (2nd from left) explains how the AUV moves during a deployment, with CGSN Team members Collin Dobson (far left) and Stace Beaulieu (far right) and student researcher Taina Sanchez (2nd from right). Credit: D. Trew Crist © WHOI.[/media-caption]
The Data Explorer provides access to all across-shelf and along-shelf AUV deployments at the Coastal Pioneer NES Array from 2016 to 2022.Future AUV transect data at the Coastal Pioneer MAB Array will also be published through Data Explorer as the data become available. As an example for reusability of these data in newly-available formats, a student examined across-shelf patterns in salinity, chlorophyll, and nitrate as part of Northeast U.S. Shelf Long-Term Ecological Research.
Read More
Biofouling Mitigation from Top to Bottom
OOI operates its arrays in challenging environments. At the sea surface, sea lions find the buoys attractive resting spots. At the bottom, instruments must collect data under varying temperatures at intense pressures. And, then throughout the water column’s photic zone is marine growth. Marine life finds OOI’s instrumentation and arrays irresistible, where it attaches and grows like gangbusters.
The folks who keep OOI’s arrays operational explain the conditions this way:
“Putting any kind of instrumentation – electrical or scientific instrumentation – in the water for a year or more at a time is always a challenge, said Dana Manalang, Engineer, OOI Regional Cabled Array (RCA). “It’s a harsh environment due to the high pressures and salt water so getting systems to operate sub-seas is the largest challenge we face.”
“It’s a challenging place to work,” concluded Coastal Endurance Array Project Manager Jonathan Fram, “And, we are very thankful to have the opportunity to make stuff that can survive in just about any marine environment.”
So how do they do it? OOI engineers develop creative ways to tackle the many challenges, particularly in terms of some of the peskier, persistent ones like keeping marine growth, referred hereafter as biofouling, at bay.
Diaper cream as a solution
Coastal and Global Scale Node (CGSN), Coastal Endurance, and RCA team members have implemented novel ways to minimize and in-situ clean marine growth on sensors, gliders, and components of the arrays that spend up to 12 months in the water.
One such novelty is the application of diaper cream. An inexpensive and convenient form of zinc oxide, diaper cream, has been used for decades as a marine anti-foulant, with moderate effectiveness. . “Its application for oceanographic equipment goes back at least to the 1990’s, and is considered non-toxic relative to other concoctions, “ explained Peter Brickley, CGSN Observatory Operations Lead. Other anti-fouling scheme exist, but some are expensive, some add weight, while others take too long to apply and don’t fit into the team’s operational deployment plans.
“The only downside is that diaper cream has be to done onboard right before deployment, or it’s a mess,” he added.
Coastal Endurance Project Manager Jonathan Fram said, “One key issue is that gliders are made of aluminum, so we can’t use copper-based antifouling material on them. Diaper cream is zinc-based, so it won’t corrode gliders’ aluminum.” The Coastal Endurance Team regularly applies diaper cream to its glider fleet, with measurable success. “Gliders with barnacles on them can’t swim straight or efficiently. The diaper cream provides a protective coating to which marine growth cannot readily adhere. It helps keep our gliders moving easily through the water and reporting data.”
[media-caption path="https://oceanobservatories.org/wp-content/uploads/2023/12/Diaper-cream-117.jpg" link="#"]Coastal Endurance team members Raelynn Heinitz and Alex Wick apply diaper cream before launch of a glider off the Oregon coast. The ointment prevents marine growth on gliders that traverse the shallow coastal waters near the Endurance Array’s Washington and Oregon-Newport lines. Marine organisms thrive in the shallow water where sunlight can penetrate, aiding marine growth. Credit: Kathy Hough, NOAA.[/media-caption] [media-caption path="https://oceanobservatories.org/wp-content/uploads/2023/12/without-diaper-cream.jpg" link="#"]Shown above is a recovered glider having spent three months in the upper coastal waters off the Washington coast. It would have been covered with marine life, imperiling its ability to maneuver, but the protective diaper cream kept most of them at bay. Credit: Kathy Hough, NOAA.[/media-caption]After being successfully tested on gliders, the Coastal Endurance Array and RCA teams then tried the protective diaper cream as an option to keeping acoustic transducers on the arrays clean, as suggested by the vendor. An acoustic transducer is an electrical device that vibrates, producing sound waves in water. OOI uses transducers in both echosounders and hydrophones. Here, too, the diaper cream proved to be an inexpensive and effective biofouling mitigation measure.
[media-caption path="https://oceanobservatories.org/wp-content/uploads/2023/12/acoustic-transducer.jpg" link="#"]An acoustic transducer covered with diaper cream to prevent biofouling during its six-months in the water. Credit: Kathy Hough, NOAA.[/media-caption]Addition of UV lights
Putting ultraviolet lights in the water to discourage marine growth is another proven biofouling mitigation measure. Early on, the Coastal Endurance team deployed two oxygen optodes, which measure dissolved oxygen, side-by-side at seven meters depth on the Oregon Shelf Surface Mooring with a UV light pointed at one of them. Data from the two sensors tracked each other for six weeks after which the unprotected sensor fouled. Within weeks, there were daily afternoon spikes of up to twice the oxygen level of the protected sensor, with slightly lower measurements than the unprotected sensor at night due to respiration of the biofilm. Since this test, optodes are regularly deployed with UV lights to aid their operation. (Annotations of OOI moored oxygen data note when a UV light was not operating with it.)
Following the success of the UV-light on dissolved oxygen sensors, the CGSN team tested this antifouling measure on a moored Coastal Pioneer Array spectral irradiance (SPKIR) sensor, which measures the amount of light energy that reaches a surface. The testing was conducted with Sea Bird Scientific, the SPKIR vendor. The vendor confirmed that the UV light did not damage the instrument’s optics nor did it interfere with its light measurements. After this confirmation and positive result, UV lights are now used on all SPKIR sensors on Surface Moorings, Coastal Surface Piercing Profilers, and uncabled digital still cameras moored at less than 70 meters. The teams adjust the on/off cycle of the UV lights so that biofouling is prevented without damaging the sensors, interfering with measurements, or using too much power.
[media-caption path="https://oceanobservatories.org/wp-content/uploads/2023/12/Screenshot-2023-11-27-at-6.02.17-PM.jpeg" link="#"]Sea Bird Scientific’s spectral irradiance sensor needs to be clean to effectively measure light energy in the water column. Shining UV lights on these sensors helps to minimize biofouling and clouding of the sensor.Credit: Sea Bird Scientific.[/media-caption]Lens-Cleaning Brushes
The RCA also has adopted novel ways to deal with biofouling on the Pacific Ocean seafloor. RCA operates and maintains a high-definition (HD) video camera (CAMHD) at the base of an actively venting hydrothermal chimney called “Mushroom” (see below) in the ASHES vent field of Axial Seamount Caldera. Live HD video of this > 4-m high chimney and surrounding seafloor is streamed to shore on an automated schedule for 14 minutes at 3-hour intervals, with longer non-stop monitoring for 24 hours twice a month and 72 hours at the beginning of each month.
[media-caption path="https://oceanobservatories.org/wp-content/uploads/2023/12/Figure-a.jpg" link="#"]RCA’s high-definition video camera installed next to “Mushroom” hydrothermal chimney in the ASHES vent field of Axial Caldera. Credit: UW/NSF-OOI/WHOI; J2-1534, V23.[/media-caption]The scene is fully scanned with programmable pan, tilt, and zoom functions of this instrument, which provides detailed imagery of the high-temperature water spigots, sea spiders, lipets tube worms and other biota covering both the chimney and surrounding lava-covered seafloor.
[media-caption path="https://oceanobservatories.org/wp-content/uploads/2023/12/Figure-b.jpg" link="#"]Close-up of the RCA HD video camera at the base of “Mushroom” hydrothermal chimney. Credit: UW/NSF-OOI/WHOI; J2-1534, V23.[/media-caption]Unfortunately, such live subjects, microorganisms, and other organic/inorganic processes often deposit a film on the camera lens which interferes with visualization. To ensure optimal clarity of HD video between site maintenance visits during annual RCA operation and maintenance expeditions, an automated lens cleaning protocol using a simple brush, installed on the instrument’s frame in the front of the lens has been instituted.
[media-caption path="https://oceanobservatories.org/wp-content/uploads/2023/12/Figure-c-.png" link="#"]Lens-cleaning brush, indicated by red arrow, installed in front of RCA’s HD video camera and used during an automated cleaning protocol. Credit: UW/NSF-OOI/WHOI; J2-1534, V23..[/media-caption]This programmed event occurs three times a month and tilts the camera down and pans it left and right, allowing the brush to gently clean the lens. The video streaming and lens cleaning schedules can be optimized remotely from shore by RCA personnel to provide the highest scientific and educational value from the HD video.
Eco Anti-fouling paint
Ever wonder why OOI’s buoys are painted blue? This eco-friendly paint serves the same purpose as diaper cream and UV lights—to minimize marine growth on the buoys and its metal components. The teams use a commercially available water-based and copper-free anti-fouling paint. Once recovered, the CGSN and Coastal Endurance Array components are taken apart and refurbished so they function like new once ready to be redeployed. All metal components and float areas are cleaned and receive a fresh coat of paint in the hope of diminishing their attractiveness to life below the surface.
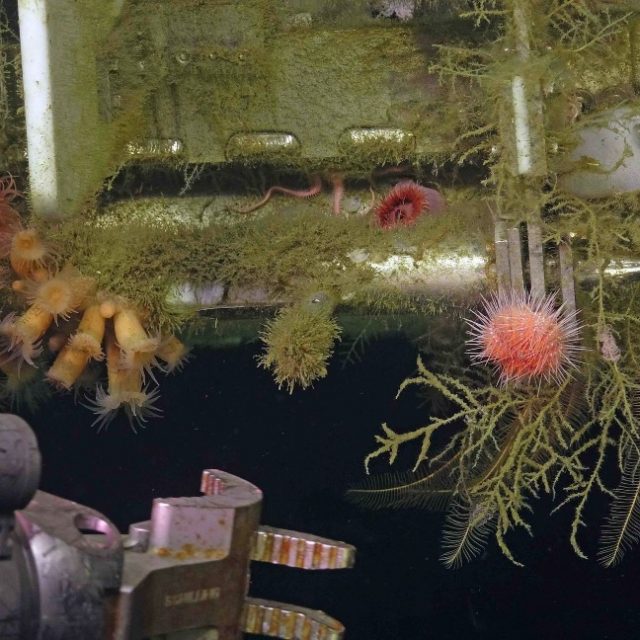
[media-caption path="https://oceanobservatories.org/wp-content/uploads/2023/12/predeployment.png" link="#"]Pre-deployment: The Coastal Pioneer buoys assembled, painted and ready for deployment for six months in the Atlantic Ocean, off the coast of Martha’s Vineyard. Credit: Derek Buffitt © WHOI.[/media-caption] [media-caption path="https://oceanobservatories.org/wp-content/uploads/2023/12/Biofouled-mooring-in-air-2023-03-17-13-33-17-2.jpg" link="#"]After six months in the northeast Pacific, the Coastal Endurance Surface mooring buoy had become a rich habitat for marine life. Credit: Kim Kenney, OSU.[/media-caption] [media-caption path="https://oceanobservatories.org/wp-content/uploads/2023/12/Pink-sea-urchins.jpg" link="#"]Biofouling can be beautiful, as demonstrated here as the ROV Jason prepares to recover the RCA Shallow Profiler during its annual operations and maintenance expedition. Credit: UW/NSF-OOI/WHOI; J2-1516: v23.[/media-caption]
Read More
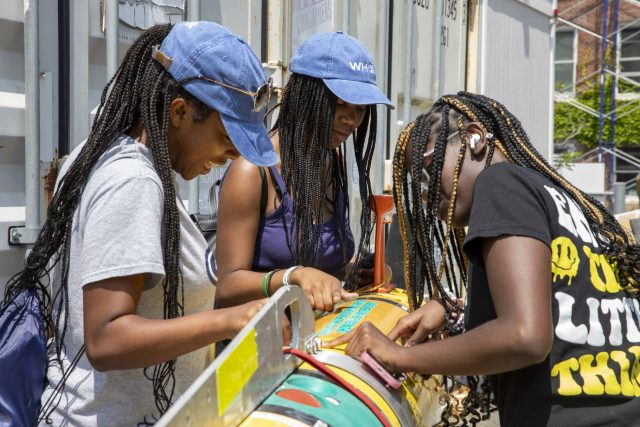
Spreading Curiosity about Ocean Science with Summer Visitors
Summertime brings students from all over the country to Woods Hole, Massachusetts to learn about ocean science. June and July 2023 were particularly busy, with the Coastal and Global Scale Nodes (CGSN) division of the Ocean Observatories Initiative (OOI) at Woods Hole Oceanographic Institution (WHOI) hosting four different student groups. CGSN offers student tours of OOI facilities and the chance to talk directly with an ocean scientist or engineer. They engage with students this way in the hope of increasing student interest in marine science and possibly encouraging them to pursue an ocean-related career. During the tours and presentations, students learn about the moorings and vehicles OOI deploys throughout the year and the dissemination of ocean data collected. These hands-on experiences give student visitors the opportunity to see the full scale and complexity of OOI operations.
UMass-Dartmouth REU Students Visit
On June 26, 12 community college engineering student and faculty from a National Science Foundation (NSF) sponsored Research Experience for Undergraduate (REU) at the University of Massachusetts, Dartmouth (UMass-Dartmouth) visited OOI. CGSN staff provided a tour of their operations, including ocean-observing equipment stored outdoors because of its size.
[media-caption path="https://oceanobservatories.org/wp-content/uploads/2023/07/Sheri-with-REUs.jpg" link="#"]CGSN team members, Dr. Sheri White (blue jeans to right) and Irene Duran (next to Dr. White) gave a tour to UMass-Dartmouth REU students. Photo by: Kama Theiler © WHOI.[/media-caption] [media-caption path="https://oceanobservatories.org/wp-content/uploads/2023/07/Colin-Dobson-with-REU.jpg" link="#"]A UMass-Dartmouth REU student asks CGSN glider expert Colin Dobson a question regarding the gliders he works on. Photo by: Kama Theiler © WHOI.[/media-caption]PEP Students Visit
In early July, the CGSN team gave a presentation to Woods Hole Partnership Education Program (PEP) participants, who spend 10-weeks in Woods Hole at WHOI, the Marine Biological Laboratory, Woodwell Climate Research Center, National Oceanic and Atmospheric Administration’s Northeast Fisheries Science Center, Sea Education Association, or the United States Geological Survey’s Woods Hole Coastal and Marine Science Center. The PEP program is designed primarily for college juniors and seniors from underrepresented groups in marine and ocean sciences who want to spend a summer gaining practical experience in marine and environmental science.
Summer 2023 is the 15th summer of the PEP program in Woods Hole. Many former PEP students have returned to Woods Hole and WHOI both as students and professionals (including CGSN’s Irene Duran). Benjamin Harden, PEP professor, stated that OOI’s community outreach is a “great way for these students to hear about the frontiers of oceanography and really helped many of them frame possible careers in the field.”
Black Girls Dive Foundation Visit
July 25th, CGSN’s Electrical Team provided a workshop to the Black Girls Dive Foundation (BGDF) program participants. BGDF provides the space and opportunity to empower young black women to explore their STEM (Science, Technology, Engineering and Mathematics) identity through marine science and conservation, and SCUBA diving. While visiting OOI, the BGDF students learned about pH and concerns about increasing ocean acidification. The students collected local sea water and with the help of the CGSN Instrument Team determined its pH with a probe they calibrated using a microcontroller.
[media-caption path="https://oceanobservatories.org/wp-content/uploads/2023/07/BGDF-with-AUV.jpg" link="#"]During their visit to WHOI, BGDF students had the opportunity to get up close to check out an Autonomous Underwater Vehicle (AUV). Photo by: Jayne Doucette © WHOI.[/media-caption] [media-caption path="https://oceanobservatories.org/wp-content/uploads/2023/07/Jennifer-with-BGDF.jpg" link="#"]CGSN Instrument Lead Jennifer Batryn (far left) shows how she checks OOI instruments operations on her laptop to one of the BGDF visitors. Photo by: Jayne Doucette © WHOI.[/media-caption]SEA Participants Visit
Also in late July a group of students participating in the Sea Education Association’s (SEA’s) High School program visited OOI’s Facility LOSOS on WHOI’s Quissett Campus. This is a study abroad program in Woods Hole for undergraduate, gap year, and high school students, that combines studies in ocean science with at-sea experiences. The students spent an afternoon learning about OOI, its operations, how data are collected and disbursed, and what scientists are learning from OOI data.
[media-caption path="https://oceanobservatories.org/wp-content/uploads/2023/07/Dee-and-Jon-With-SEA-students-2.jpg" link="#"]CGSN team members Dee Emrich (standing left) and John Lund explained OOI operations to high school students from the Sea Education Program. Photo by: Dr. Sheri White © WHOI.[/media-caption] [media-caption path="https://oceanobservatories.org/wp-content/uploads/2023/07/Irene-with-SEA-students.jpg" link="#"]CGSN Engineer Irene Duran (maroon top in center) showed mooring components to high school students from the Sea Education Program. Photo by: Paul Whelan © WHOI.[/media-caption] Read MoreThe Great Salinity Anomaly of 2015-2020
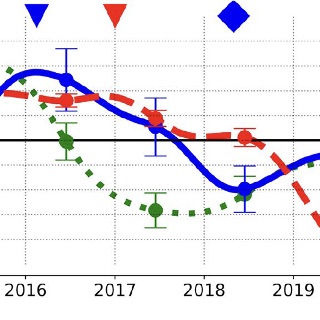
The Great Salinity Anomaly of 2015-2020. Adapted by OOI from Biló et al., 2022.
[media-caption path="https://oceanobservatories.org/wp-content/uploads/2023/07/Bilo-.png" link="#"]Figure: Time series of salinity anomalies from OSNAP moorings near the Reykjanes Ridge (RR) and within the western boundary current of the Irminger Sea (CF6), and from OOI Flanking Mooring (FLB) in the Irminger Sea (FLB). The eighteen-month low-passed anomalies are averaged between 0 and 200 m depth and computed relative to the mean of the moored data record. Error bars show 95% confidence intervals for annual salinity averages. The blue (red) triangles and diamonds represent the start and end of the freshening period in the CF6 (FLB) records, respectively.[/media-caption]Unusual surface freshening episodes in the Subpolar North Atlantic have been documented since the 1960s when the term Great Salinity Anomaly (GSA) was coined to refer to the first documented event (Dickson et al., 1988). GSAs are of great importance because the reduction in surface density of North Atlantic surface waters increases vertical stratification, suppresses deep water formation, and weakens the Atlantic Meridional Overturning Circulation (AMOC). Deep (700-1000 m) wintertime convection in the Irminger and Labrador Seas creates the water mass constituting the northern portion of the AMOC’s lower limb, which transports cold water back to southern latitudes. Thus, sustained changes to deep water formation due to a GSA will impact the global climate system.
New work by Bilo et al. (2022) argues that there has been another GSA during 2015-2020, with significant salinity reduction in the upper 200 m of the Iceland Basin and Irminger Sea. The authors use hydrographic data and moored observations to document the spatial extent and propagation pathways of the GSA.
Hydrographic data come from the Argo float monthly climatology and from UK Met Office Hadley Centre “enhanced” version 4 (EN4) historical hydrography. These spatial data sets allow the basin-wide salinity changes to be diagnosed, and show that between 2015 and 2020 the upper 200 m of the central Irminger Sea freshened by 0.1-0.2 PSU. The observed freshening rate of up to 0.04 PSU per year is among the fastest salinity decreases ever recorded in the region. The regional maps show the freshening first in the Iceland Basin and later in the Irminger Sea.
Moored observations come from the Overturning in the Subpolar North Atlantic Program (OSNAP) and from the OOI Irminger Sea Array. Two OSNAP moorings are evaluated, one on the eastern side of the Irminger Sea near the Reykjanes Ridge and one on the western side within the southward-flowing boundary current. OOI Flanking Mooring B was used to represent conditions in the central Irminger Sea. The results (Figure above) show a salinity minimum near the Reykjanes Ridge in 2017 followed by a minimum at the western boundary in 2018 and finally a significant (~0.1 PSU) salinity reduction in the Irminger Sea interior in 2019. Estimated transit times from the mooring data indicate that the salinity signal is advected quickly (months) by Irminger Sea boundary currents after crossing the Reykjanes Ridge and then spreads more slowly to the interior, taking of order two years to impact the central Irminger Sea.
The authors note that although climatologies are important to determine regional changes, these data are mostly limited to deep water. Moorings can provide data within the boundary currents, as well as well-resolved temporal evolution at multiple locations. This underscores the importance of a hybrid ocean observing system combining historical climatologies, broad spatial coverage (Argo), and time series data (OSNAP, OOI).
_______________________________________________
Biló, T.C., F. Straneo, J. Holte and I. Le Bras, (2022). Arrival of new Great Salinity Anomaly weakens convection in the Irminger Sea. Geophysical Research Letters, 49, e2022GL098857, doi:10.1029/2022GL098857.
Dickson, R.R., J. Meincke, S.-A. Malmberg, and A.J. Lee (1988). The great salinity anomaly in the Northern North Atlantic 1968–1982″. Progress in Oceanography, 20 (2): 103–151, doi:10.1016/0079-6611(88)90049-3.
Read MoreChlorophyll Enhancement at the Shelfbreak
Adapted and condensed by OOI from Oliver et al., 2022, doi:/10.1029/2021JC017715.
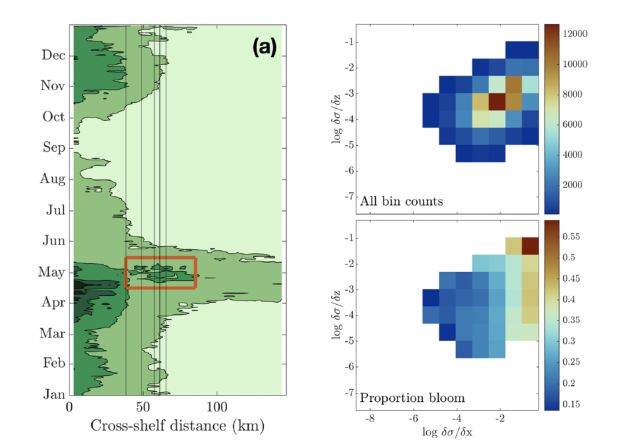
[media-caption path="/wp-content/uploads/2022/08/Screen-Shot-2022-08-18-at-3.10.51-PM.png" link="#"](left) Eighteen-year composite annual cycle of surface chlorophyll concentration from MODIS satellite. Vertical lines indicate the shelfbfreak region (depths 75 to 1,000 m); red box highlights chlorophyll enhancement at the shelfbreak. (right; upper) OOI glider data with more than 100 chlorophyll observations within horizontal and vertical density gradient bins and (lower) proportion of bins with chlorophyll > 2 mg/L, indicating a bloom. From Oliver et al., 2022.[/media-caption]The enhancement of chlorophyll due to phytoplankton blooms is recognized to occur near the frontal boundary of the New England Shelf, but the blooms are ephemeral and not consistently found in satellite remote sensing of ocean color. In a recent study, Oliver et al., (2021) show that enhanced surface chlorophyll concentrations at the shelfbreak are short lived events, and are associated with periods when a surface layer of lighter shelf water moves over denser slope water at the shelfbreak front. Both data and a computational model show that eastward, upwelling-favorable winds are the primary driver of the frontal restratification and localized enhanced surface chlorophyll.
The study used a variety of data sources, including MODIS satellite chlorophyll estimates, shipboard CTD casts from a Shelf-break Productivity Interdisciplinary Research Operation at the Pioneer Array (SPIROPA) cruise and a Pioneer mooring turn cruise, Pioneer glider density and chlorophyll, and atmospheric reanalysis winds after comparison with Pioneer surface mooring winds. A two-dimensional configuration of the Regional Ocean Model System (ROMS) coupled to a nitrogen-phytoplankton-zooplankton-detritus (NPZD) model was used to simulate the wind-driven response.
The eighteen-year time-evolution of the cross-shelf distribution of surface chlorophyll concentration from MODIS showed that shelf-break chlorophyll enhancements were evident in most years, followed an inshore spring bloom in April, and were typically seen during a short period in the spring (mid-April – mid-May; Figure above). For individual years, the shelf-break chlorophyll enhancements were short-lived, typically lasting less than a week. Pioneer Array glider data were used to explore the relationship between enhanced chlorophyll concentrations and both horizontal (assumed to be associated with the shelfbreak front) and vertical density gradients. Near surface (upper 30 m) chlorophyll concentrations were collected in log-transformed density gradient bins and then displayed according to the proportion of bins with chlorophyll > 2 mg/L, indicating a bloom. The “bloom bins” were associated with high horizontal density gradients and a range of vertical density gradients, indicating that frontal restratification is associated with enhanced chlorophyll at the shelfbreak (Figure above).
The study concludes that enhanced surface chlorophyll events at the New England shelfbreak occur consistently in the spring, but are transient, lasting only a few days to a week, and thus not discernible in seasonal climatologies. Periods of enhanced chlorophyll are associated with strong horizontal density gradients and appear to be triggered by the increase in stratification resulting from wind-driven cross-shelf advection of less dense shelf water over denser slope water. This process creates a shallow mixed layer at the front which alleviates light limitation and supports transient surface enhancements of chlorophyll.
Oliver, H., Zhang, W.G., Archibald, K.M., Hirzel, A.J., Smith, W.O. Jr, Sosik, H.M., Stanley, R.H.F and D.J. McGillicuddy Jr (2022). Ephemeral surface chlorophyll enhancement at the New England shelf break driven by Ekman restratification. Journal of Geophysical Research: Oceans, 127, e2021JC017715. https://doi.org/10.1029/2021JC017715.
Read MoreAtlantic Water Influence on Glacier Retreat
Adapted and condensed by OOI from Snow et al., 2021, doi:/10.1029/2020JC016509
The warming of Atlantic Water along Greenland’s southeast coast has been considered a potential driver of glacier retreat in recent decades. In particular, changes in Atlantic Water circulation may be related to periods of more rapid glacier retreat. Further investigation requires an understanding of the regional circulation. The nearshore East Greenland Coastal Current and the Irminger Current over the continental slope are relatively well studied, but their interactions with circulation further offshore are not clear, in part due to relatively sparse observations prior to establishing the OOI Irminger Sea Array and the Overturning in the Subpolar North Atlantic Program (OSNAP).
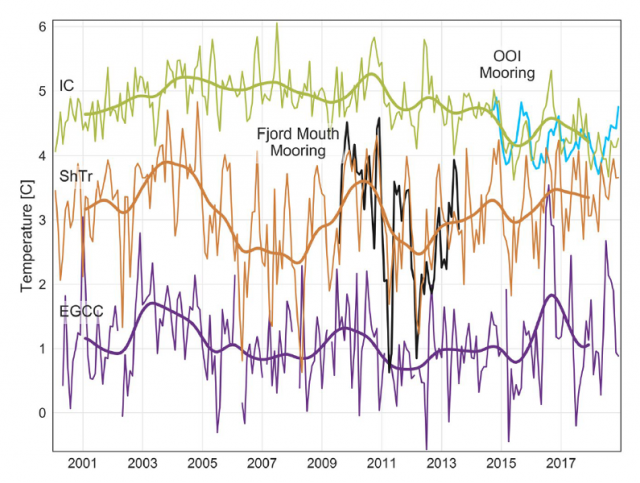
[media-caption path="/wp-content/uploads/2022/04/Pioneer-highlight.png" link="#"]Satellite-derived sea surface temperature after adjustment for the Irminger Current (IC; green), Shelf Trough (ShTr; orange), and East Greenland Coastal Current (EGCC; purple). Monthly values (thin lines) are shown for 2000-2018 with 24-month low-passed records overlain. In situ observations from the fjord mouth (290 m: Black) and OOI flanking mooring FLMA (180 m; blue) are shown for comparison.[/media-caption]
In a recent study (Snow et al., 2021) use in-situ mooring data to validate satellite SST records and then use the 19-year satellite record to investigate relationships between glacier melt and Atlantic Water variability. In order to use the satellite records for this purpose, several adjustments must be made, including accounting for cloud and sea ice contamination, eliminating seasonally-varying diurnal biases, and removing the influence of air temperature. This adjusted satellite SST can be compared to in-situ mooring data during a portion of the record. A coastal mooring near the Sermilik Fjord mouth and the OOI Irminger Sea Array provide useful records during 2009-2013 and 2014-2018, respectively (Figure 24). An interesting aspect is that the temperature record from OOI Flanking Mooring A (FLMA) is useful for this purpose even though the measurements are at 180 m depth. This is because the upper ocean is relatively homogeneous in this region, and the mixed layer is deeper than 180 m during much of the year. The authors find that the adjusted satellite SST is consistent with the in-situ records on monthly to interannual time scales (Figure above). This provided the motivation to investigate relationships between the 19 year satellite record and glacier discharge rates.
The study concludes that warmer upper ocean temperatures as far offshore as the OOI Irminger Sea Array were concurrent with increased glacier retreat in the early 2000s, in support of the idea that Atlantic Water circulation plays a role. However, they also note that this influence is not direct, because of substantial variation in how Atlantic Water is diluted as it flows across the shelf towards Sermilik Fjord. The idea that time-varying dilution of Atlantic Water governs the temperature of water reaching the glacier was not previously understood, and resolving such small-scale, time-varying processes is a challenge for models. The authors conclude that with appropriate adjustments, “[satellite] SSTs show promise in application to a wide range of polar oceanography and glaciology questions” and that the method can be generalized to other glacier outflow systems in southeast Greenland to complement relatively sparse in-situ records.
Snow, T., Straneo, F., Holte, J., Grigsby, S., Abdalati, W., & Scambos, T. (2021). More than skin deep: Sea surface temperature as a means of inferring Atlantic Water variability on the southeast Greenland continental shelf near Helheim Glacier. J. Geophys. Res: Oceans, 126, e2020JC016509. https://doi.org/10.1029/2020JC016509.
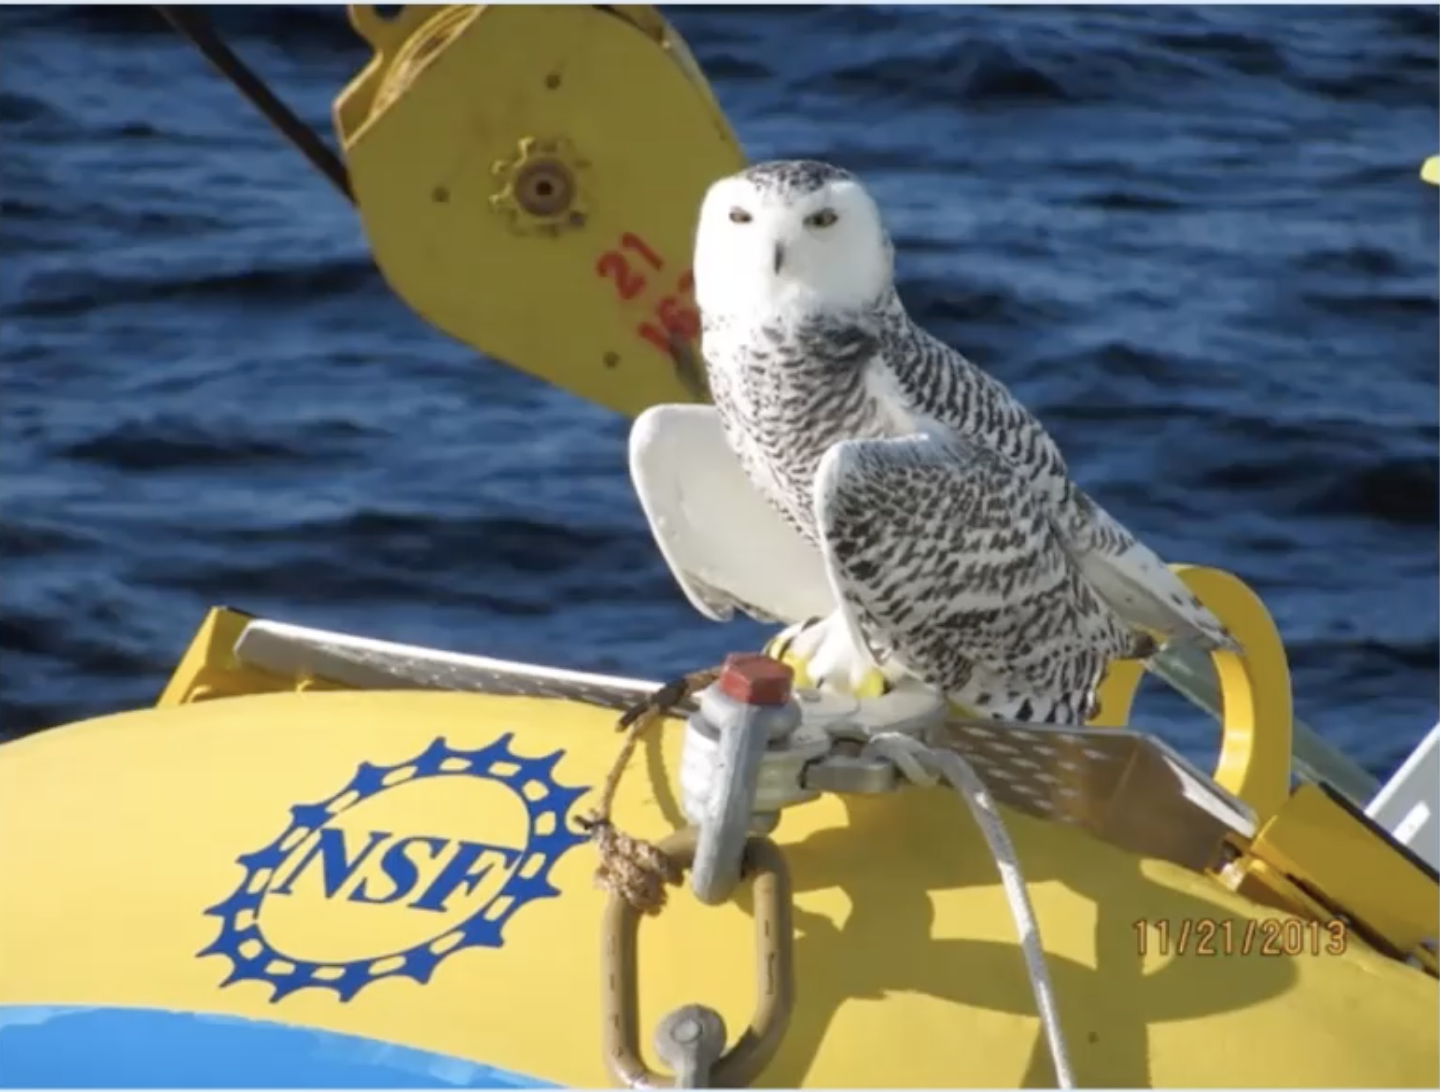
Read MoreIrminger Sea Array Overcomes Challenging Conditions to Provide Climate Insights
Deployed 140 miles east of the southern tip of Greenland and three miles south of the Arctic Circle, the Irminger Sea surface mooring floats on a cold empty sea named for a Danish naval admiral few people have heard of, in a location that few people could point to on a North Atlantic chart. The Irminger Sea is delineated less by coastlines or geographic basins and more by what is taking place within the deep ocean here, processes only visible with the aid of deep-sea instruments. To oceanographers and climate scientists the region is a confluence of ocean currents where heat carried from the topics gets extracted and cold water sinks into abyss like few other places worldwide and with climate-changing impacts.
Like most high-latitude oceans, storms are frequent and strong. Some storms migrate northeast from the mid-latitudes. Other storms are born here and then mature to impressively violent conditions influenced by the distant high mountains and massive Greenland icecap. Gale-force winds and steep-faced ocean waves spread east over a wide cone from the tip of Cape Farewell. The ice pack around Greenland ejects icebergs, some washing far out to sea where they threaten vessels. Cold air and sea spray build layers of heavy ice on exposed surfaces and instrument sensors. Other oceans can be found with higher waves, some have colder weather, but in few places do storms intensify so quickly, occur as often, and happen in a place so vital to planetary climate. Right where the storm forces are the strongest is also the perfect place for a tower packed with weather instruments.
The Irminger Sea mooring is designed to collect data in this stormy world where meteorological and ocean measurements, especially at the surface, are rare and hard to sustain. The mooring is recovered and a new one put in its place once a year, typically during the short summer month of July when weather conditions are calmest. At more than 4 meters high, the surface mooring tower is heavily instrumented with meteorological sensors and communication antennas, and the surface float is filled with data loggers and redundant computing elements and controllers that collect, store, and transmit data to shore. In total about four tons of floating equipment is anchored to the bottom by a 1.5-mile cable studded with dozens of instruments sampling the deep interior of this sea. To power everything, the buoy float is packed with rechargeable batteries, fueled by solar panels and wind turbines on the buoy tower. Strong winds are usually welcome because they rapidly re-charge the battery packs. Sometimes, however, these can be too much of a good thing.
[media-caption path="/wp-content/uploads/2021/12/Irminger-storm-waves.png" link="#"]Storm waves captured by the Irminger Sea tower camera #5 on 2019-03-19 at 09:01:00 UTC during a typical bad weather day. Observations made by the WAVSS instrument (from 09:00 to 09:20 UTC) report significant wave heights around 5 m (16 ft) and maximum heights of 21 m (69 ft). Records from a second accelerometer (MOPAK) report a wave ~5 m high passing at 09:01 UTC, possibly the same one in this photo. About half-a minute later, at 09:01:30 UTC, the MOPAK recorded a wave >20 m (no image).[/media-caption]
A recent storm during October 18-19, 2021, was one such time. The mooring was battered by wind speeds exceeding 35 knots (gale force) for almost 24 hours, with some topping out above 50 knots. Heavy storm seas built up and stacked upon themselves for hours. At the storm’s peak, about one third of the highest waves were above 15 m (49 ft). Picture heaving an 8000 lb. surface mooring 80 ft up and down on a tilt-a-whirl ride that never stops. Waves this high can bring tons of water crashing down. Towering waves were recorded, some reaching up to 20-25 m (66-82 ft), so high they approached the limits of our instruments.
The Irminger Sea continues to test our ability to “weather harden” instruments in stormy parts of the world. From November to March, daylight is fleeting, the sun hovers near the horizon and solar panels trickle out only a few milliamps. For the next few months, many of the instruments in the ocean interior and on the tower will continue to sample, each instrument powered by its own small battery. The Irminger surface mooring will communicate once each day, a tiny burst of data with vital signs, until spring returns and the sun revives the cold battery packs.
[media-caption path="/wp-content/uploads/2021/12/Ice-near-mooring-.png" link="#"]Ice near the Irminger Sea mooring 2019-04-02. Credit: @WHOI, Peter Brickley.[/media-caption]
The 2021 storm demonstrated, yet again, the challenges of working in the Irminger Sea. Yet, it also demonstrated the remarkable robustness of the OOI moorings in such extreme conditions. Ocean and meteorological measurements gathered by the Irminger Sea mooring during such storm events are extremely valuable for understanding oceanography and climate processes. Equally important is the invaluable experience gained that will drive continued improvement in the accuracy and durability of instruments deployed under such extreme conditions, with consequent increases in knowledge.
Written by Peter J. Brickley, PhD, Senior Engineer, AOPE Dept., Woods Hole Oceanographic Institution and OOI’s Coastal and Global Scale Nodes Observatory Operations Lead
Read More
Ride Along with Pioneer 17
After a three-day weather delay, on Friday 29 October, the 14-member Pioneer Array science party will board the R/V Neil Armstrong in Woods Hole, MA and head toward the array, 75 nautical miles south of Martha’s Vineyard. The team will recover and deploy moorings and instrumentation to keep the array operational, collecting and sending data back to shore.
What’s novel about this mission is not only is it the 17th time the array will have been “turned,” but this time, you can follow along. Bookmark this link for regular updates of progress, conditions, and life at sea. The team promises a good ride along.
Read More