
Posts Tagged ‘Data’
Funding Opportunity to Support Dissemination and Use of OOI data
The Ocean Sciences Division of the National Science Foundation (NSF) issued a “Dear Colleague letter” on 18 February to encourage wider use of the OOI data by supporting workshops, conferences or other training events to introduce researchers and educators to available data and community tools.
NSF is encouraging researchers or educators to propose workshops, conferences or other training events to 1) teach other researchers or educators how to use available tools and data; 2) develop additional community tools or instructional material to use the OOI data; or 3) create communities of practice that use the data for multi-investigator, community-driven research purposes. The goal of such activities is to promote development and dissemination of the OOI data tools and research opportunities.
Two- and four-year U.S. institutions of higher education and U.S. non-profit non-academic organizations are eligible to submit relevant proposals.
NSF intends to support about 15-20 awards in FY2020. Proposals may be submitted at any time, but at least six months prior to the planned event. To be considered for FY2020 funding, proposals should be submitted before May 15th. Submission details are available here.
Read MoreOOI moorings provide sustained observations of the Irminger Sea Deep Western Boundary Current
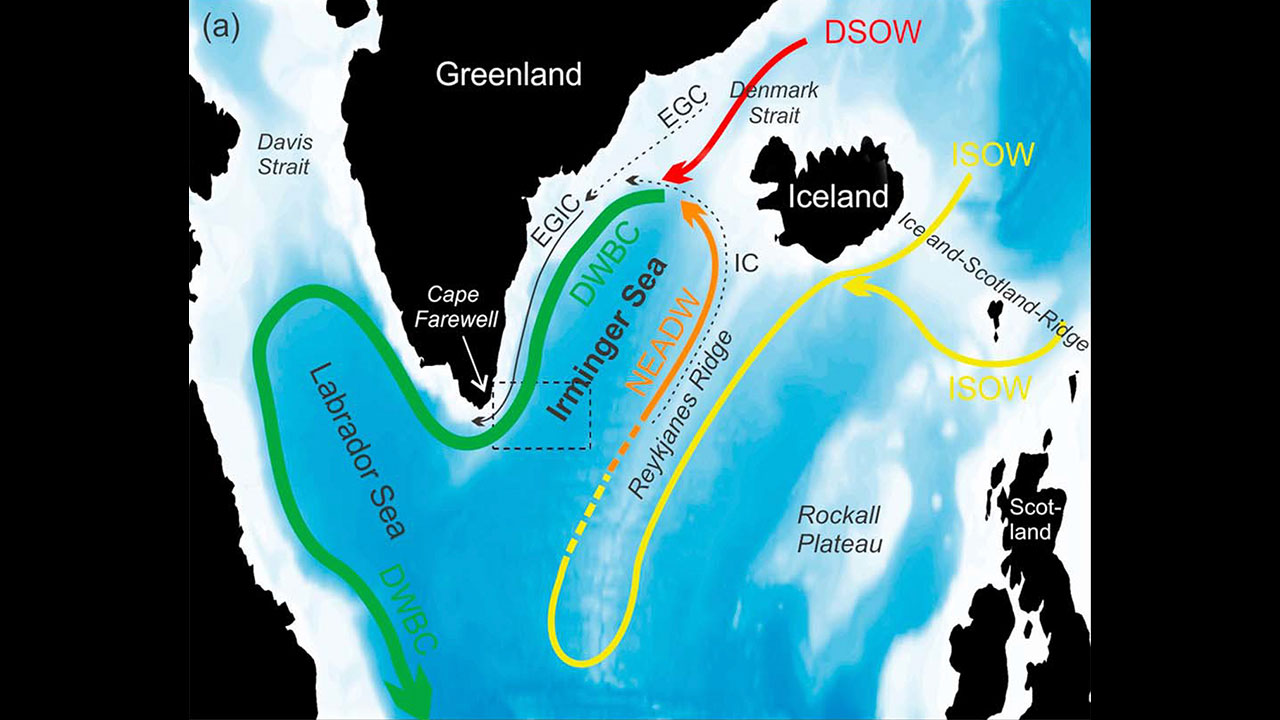
Data from the Ocean Observatories Initiative (OOI) Global Irminger Sea Array contributed to the longest continuous record of total volume transport of water in the Deep Western Boundary Current. This current, in the subpolar North Atlantic, travels southwest along the continental slope off of Greenland and is considered a significant part of the global climate system.
In a recent Journal of Geophysical Research Letters: Oceans paper, Dr. Joanne Hopkins at the National Oceanography Center in Southampton, U.K., and collaborators used data from two U.S. OOI flanking moorings, along with three U.S. Overturning in the Subpolar North Atlantic Program (OSNAP) East Greenland Current array moorings, and five U.K. OSNAP moorings to study the total amount of water moved by the current over a period of two years, as well as its daily and seasonal variability.
The data used for this paper was gathered over 22 months between 2014 and 2016, while all 10 of the moorings were in the water for the same period. Previous research to determine transport estimates at this latitude have been limited by a sparse number of direct and sustained measurements, relying instead on measurements over 9.5 months, 60 days, and “snapshot” or repeated summertime hydrographic sections.
Hopkins et al estimate that the Deep Western Boundary Current transports an average of 10.8 × 10⁶ m3 of water per second with variation in time. In addition, the transport variability shifts from high to low frequencies with distance down slope. While the results did suggest an increase in transport since 2005-2006, they did not conclude that there was a significant long-term trend, given the limitations of previous data sets.
The location of the OOI Global Irminger Sea array was selected as part of an effort by the scientific community to place moorings in areas that have been historically under-sampled and subject to high winds and sea states that make frequent ship-based measurements difficult. The OOI Data Portal provides access to data from the Irminger Sea Array dating back to the initial installation in September 2014.
Read More2018 OOI Data Workshops – Apply Now
The OOI is hosting several workshops for early-career scientists (PhD candidates, postdocs and pre-tenure faculty up to 7 years post-PhD) interested in learning more about the OOI and how to use data from the program in their work.
Read MoreMachine to Machine Interface Resources and Community Tools
The OOI is pleased to announce the release of the OOI Machine-to-Machine (M2M) interface for data download.
The M2M interface provides programmatic access to OOI data and metadata via a RESTful Application Programming Interface (API). It allows authenticated users to request small amounts of data via synchronous JSON requests, request larger amounts of data in NetCDF or CSV format in order to download multiple data streams or data from multiple platforms, or set up recurring downloads to procedurally update an existing dataset. Additional commands allow for searches of the asset management system to find deployment, calibration, quality control (QC) parameters, annotations, and other information, both in bulk and for specific instruments or platforms.
Full documentation of the M2M system is underway, but there are several existing “Community Tools” resources to assist in getting started using the API. Step by step instructions and sample code are now available on the OOI Website. In addition, the OOI Data Evaluation Team will be holding instructional webinars and posting additional guides and video tutorials in the Knowledge Base in the coming months.
For additional help using the interface, if you encounter errors, or if you have suggestions, please contact the HelpDesk.
Read MoreOOI ERDDAP Server Now Online
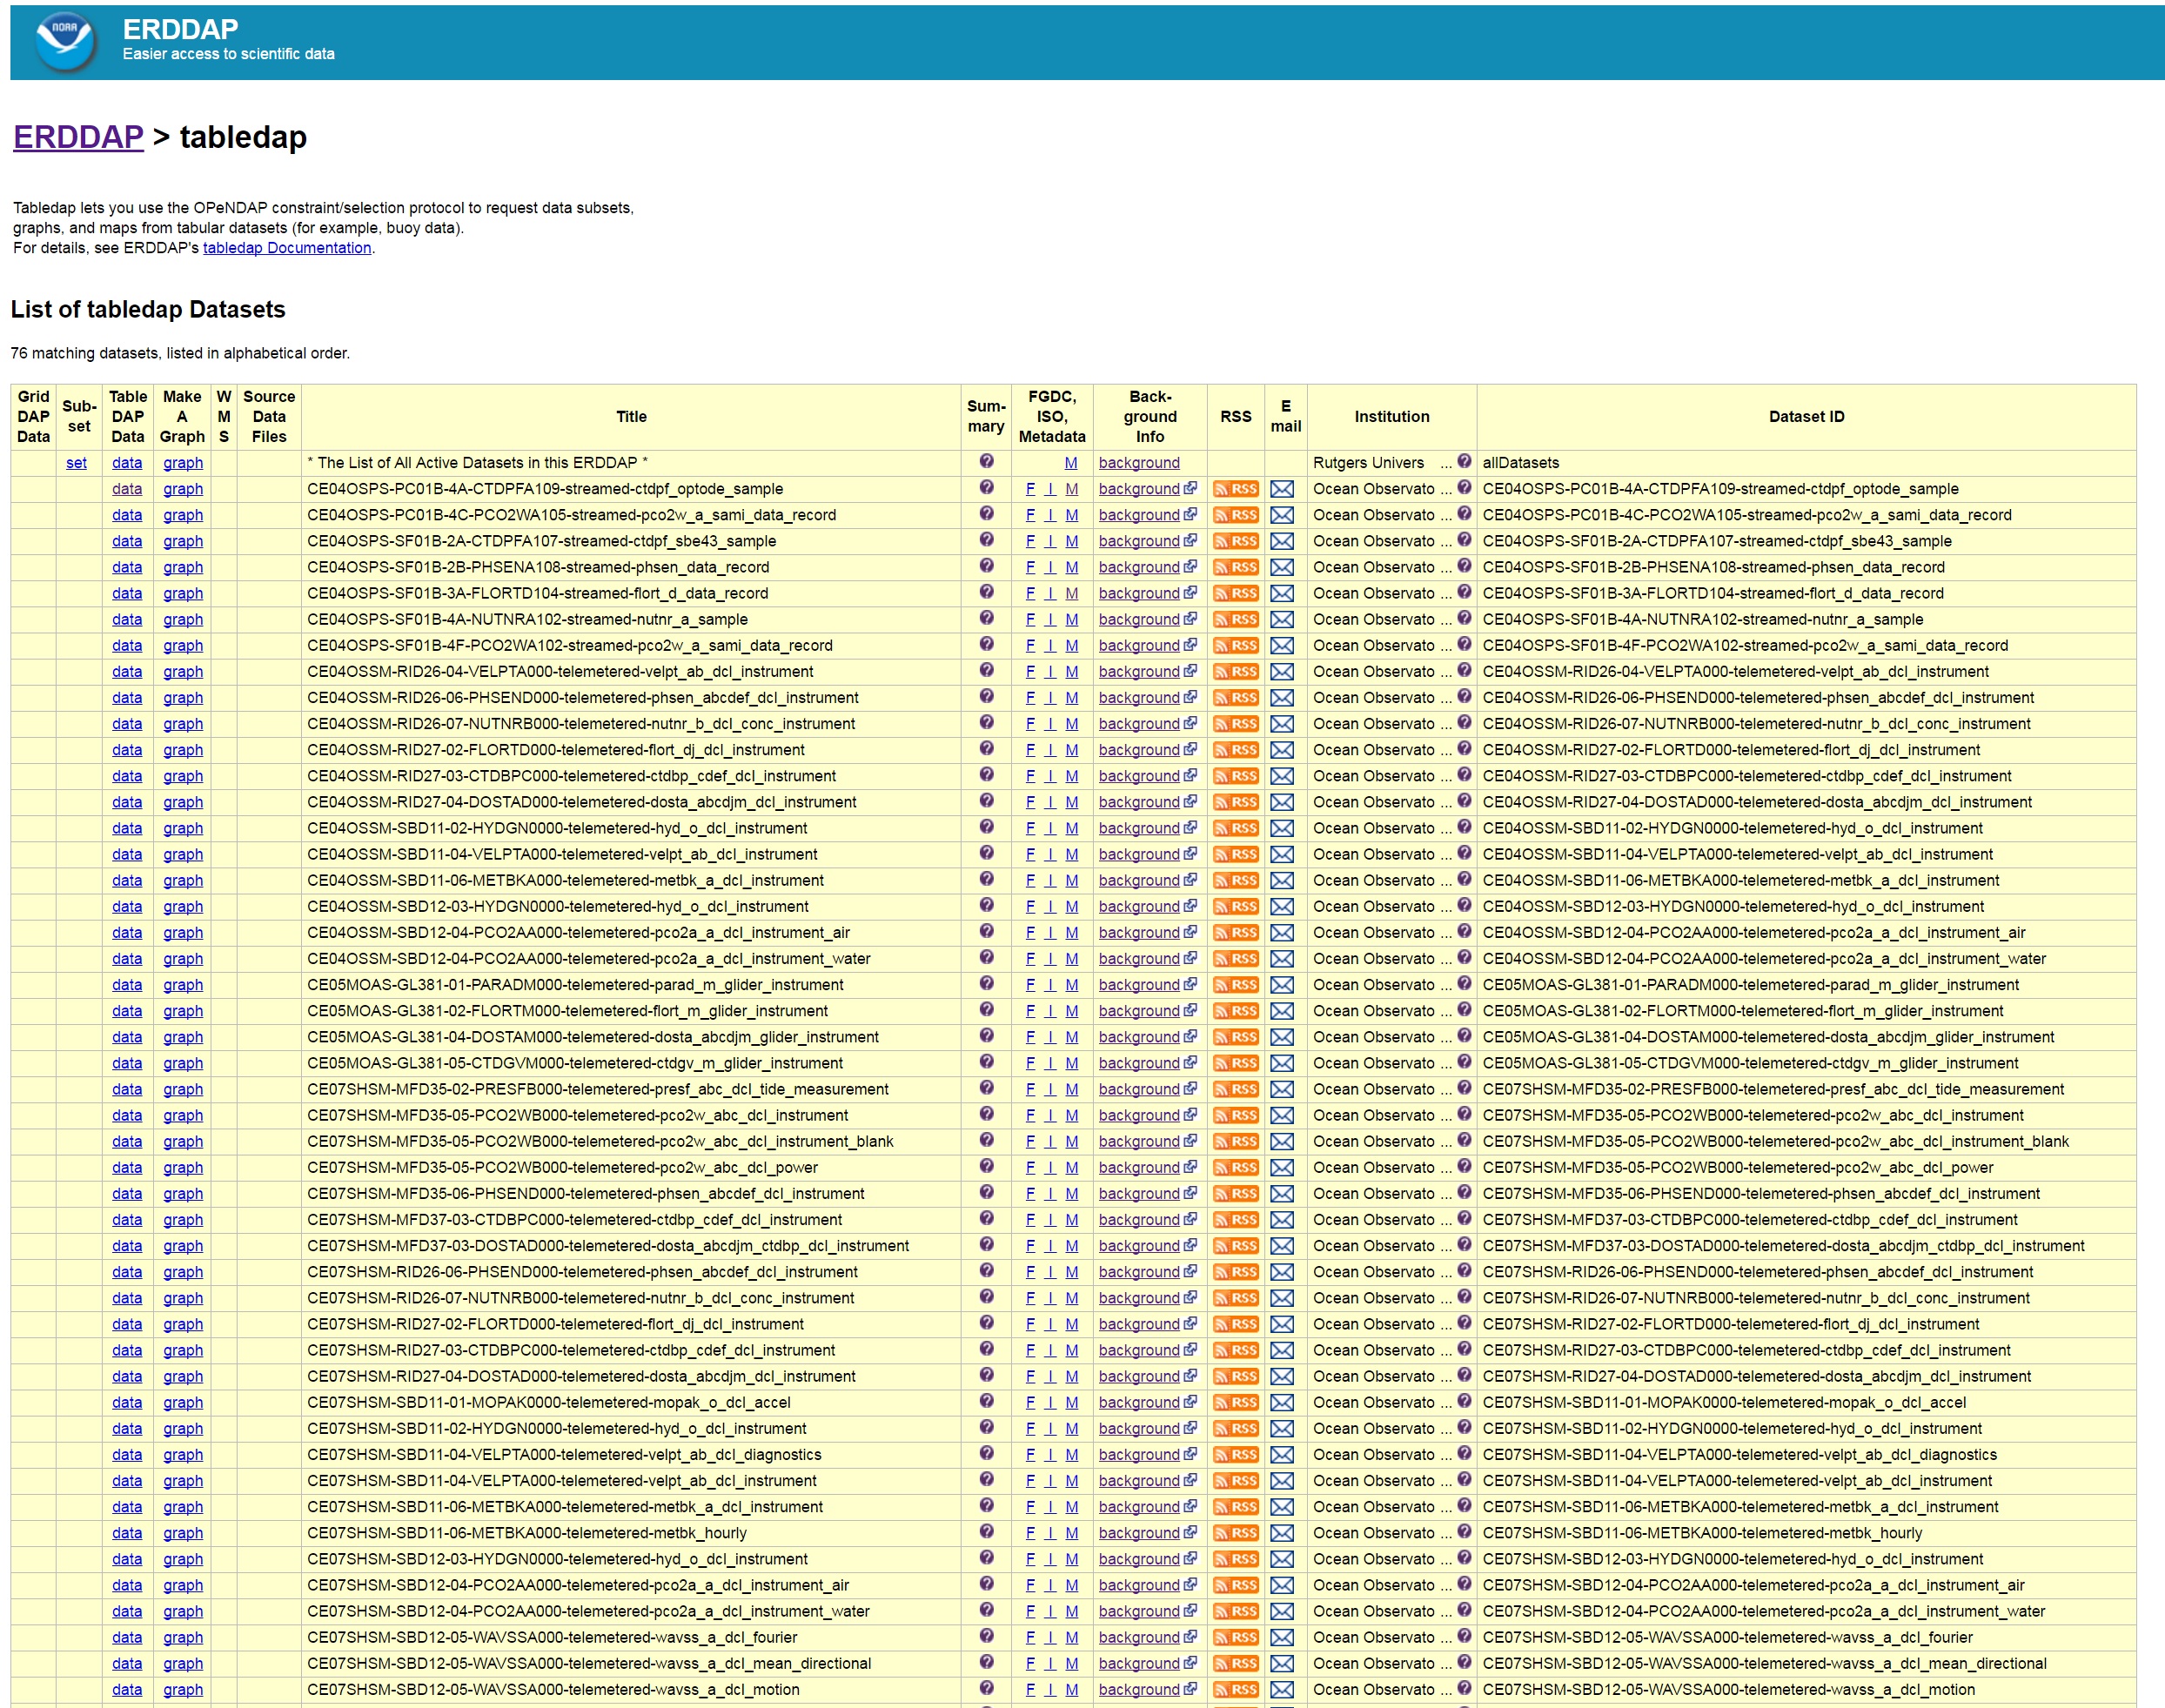
The OOI ERDDAP server is now online hosting uncabled, telemetered data from OOI moorings and gliders.
Read MoreOOI Data Portal Updated
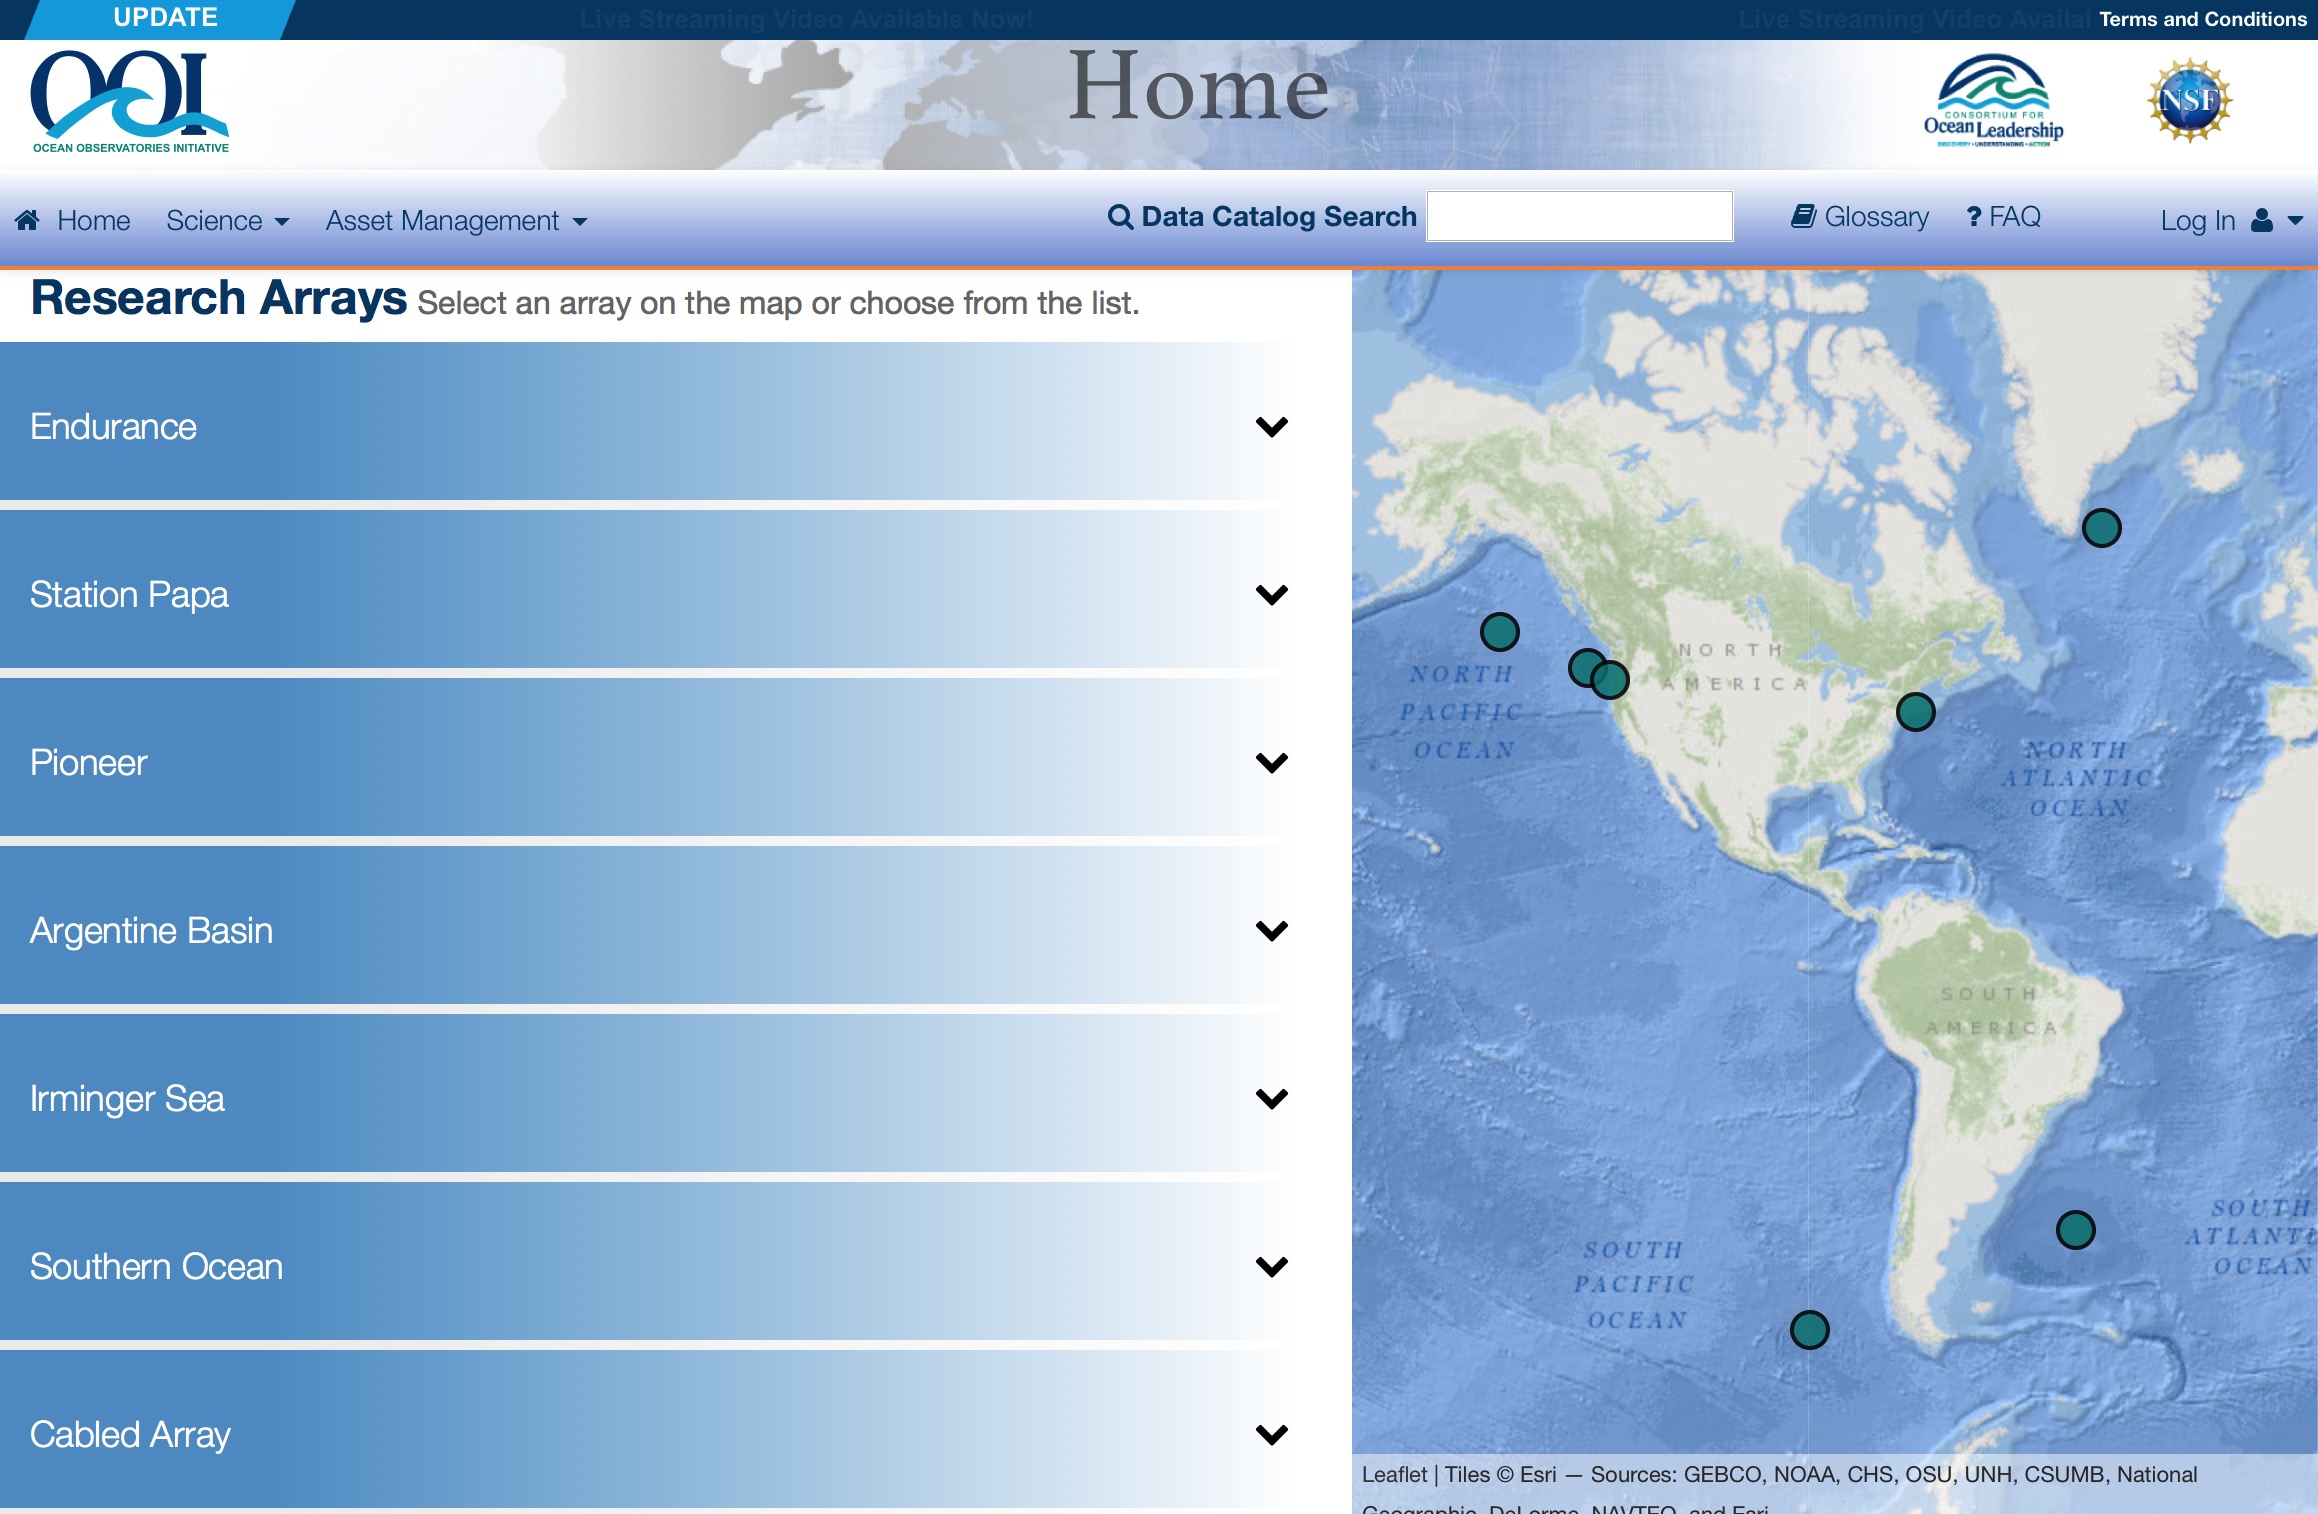
Over the last month we have been working on improving and streamlining the OOI User Interface based on your feedback. As of this morning, the new user interface officially replaced the old one on ooinet.oceanobservatories.org.
Read MoreUpdated OOI User Interface now Live for Testing & Feedback
OOI User Community and Colleagues,
We have been working on some improvements and streamlining of the OOI User Interface. Changes have been made to the format and functionality of the initial landing page, platform information pages, plotting capabilities, and data catalog. Hopefully these changes result in improved usefulness of the site and upgraded ability of users to locate and use data of interest.
[button link="https://ooiui.oceanobservatories.org/"]Preview the new OOI User Interface[/button]We are making the new site available now in order to get feedback on user experiences before it officially replaces the existing user interface.
Please send any feedback or recommendations to help@oceanobservatories.org no later than September 16th.
The site will continue to be enhanced and more capabilities will be added over the next few months as our list of planned upgrades are completed. We also plan to continue upgrading the site based on your user feedback. The existing user interface is still available (here). You may continue to send feedback after the 16th, but we will use the information we receive before then to determine how we proceed with the next phases of the new GUI rollout.
Note that the preview site is using a temporary URL (ooiui.oceanobservatories.org), when the new GUI goes live it will replace the current site (ooinet.oceanobservatories.org).
As you explore the site, please note that there are a few known issues to be aware of during testing. You are free to test any areas of the site, but there is already work underway on the following items:
- Landing page array maps are being updated to include detailed bathymetry and as-designed locations of individual platforms to provide a better idea of where assets are deployed.
- While searching through the data, you may encounter some blank location, depth, or deployment fields. This is due to an overhaul of asset management information behind the scenes.
- Plotting of acoustic data (e.g. ADCP) using binned pseudocolor plots is a work in progress. The option is available, but results may not be formatted correctly.
- Currently only parameters from a single data stream can be shown on a single plot. If you attempt to add parameters from another instrument or multiple streams, you will receive an error message indicating the lack of interpolation functionality.
- Platform-level visualization of status information for instruments in the water using a standard color-code is in progress but not yet implemented.
- A History and Status page for mobile assets (gliders and AUVs) is under construction. This page will allow for visualization of ideal glider lines and actual glider tracks based on GPS position.
- A site tour overlay for the new site’s functionality is being prepared, and will be added to based on your feedback.
Thank you,
OOI Graphical User Interface Team
OOI data now available from NANOOS
Northwest Association of Networked Ocean Observing Systems (NANOOS) is now serving OOI data on their NANOOS Visualization System (NVS). Data from the OOI Coastal Endurance OR and WA Line Surface Moorings can now be viewed along side other sources including NANOOS, NSF CMOP, NOAA NDBC, and CDIP.
This effort marks the beginning of the larger effort to integrate OOI data into existing public data repositories to increase user access to these data and further facilitate interdisciplinary research by putting the OOI infrastructure in the context of other data available in the area.
Stay tuned as we continue to reach out to organizations, like IOOS, to cross post our data!
Interested in what else the community is up to with OOI data? Check out the Community Resources page on our website.
Read MoreSuccessful SME Evaluation – Spectrophotometer (OPTAA)
Because of the great diversity of the sensor types deployed by the OOI, it is understood that the familiarity and knowledge of the OOI program scientists and the data team members may not be sufficient to fully investigate and evaluate all types of data being collected. In order to validate the data from these instruments, we reached out to the experts in the field, or as we like to call them “SMEs” (Subject Matter Experts).
For this task, the OOI team asked the SMEs to take a segment of raw data from a specific instrument, and to apply their knowledge and processing tools together with the requisite calibration, sampling, and metadata to produce a calibrated, engineering units version of the data and assess its validity. Assessing validity means answering whether or not the instrument is working properly and yielding data that is realistic. It also means examining whether or not the sampling protocol implemented for the deployment is appropriate to achieve the scientific goals of deploying that instrument.
One of the instruments examined was the WET Labs AC-S Spectrophotometer deployed on the Endurance Array Washington Offshore Surface Mooring on the west coast. Our SME for this instrument was Emmanuel Boss (University of Maine), an expert in the use of optical instrumentation to study the properties of material suspended in seawater.
With the data team’s help, Dr. Boss verified 1.5 months of data (April-May 2015) at this site with successful results. He was able to process and plot the data using the raw data and vendor calibration files from the AC-S, salinity and temperature from a collocated CTD data to correct absorption and attenuation median spectra and scattering, and data from a collocated fluorometer to cross-check the chlorophyll and POC results.
Consistency between the sensors suggests that they did not foul during the deployment. Not only did his results show that accurate data was being produced by all the sensors in question, but the AC-S (an extremely sensitive instrument normally deployed for very short periods of time) did not drift noticeably during the deployment period, a notable achievement.
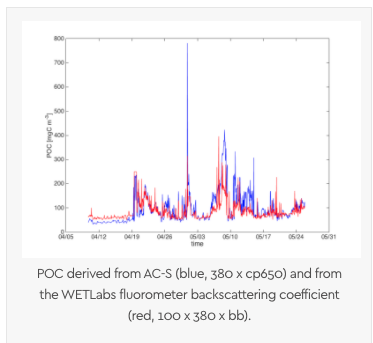
[twocol_one] [caption id="attachment_10536" align="alignnone" width="500"]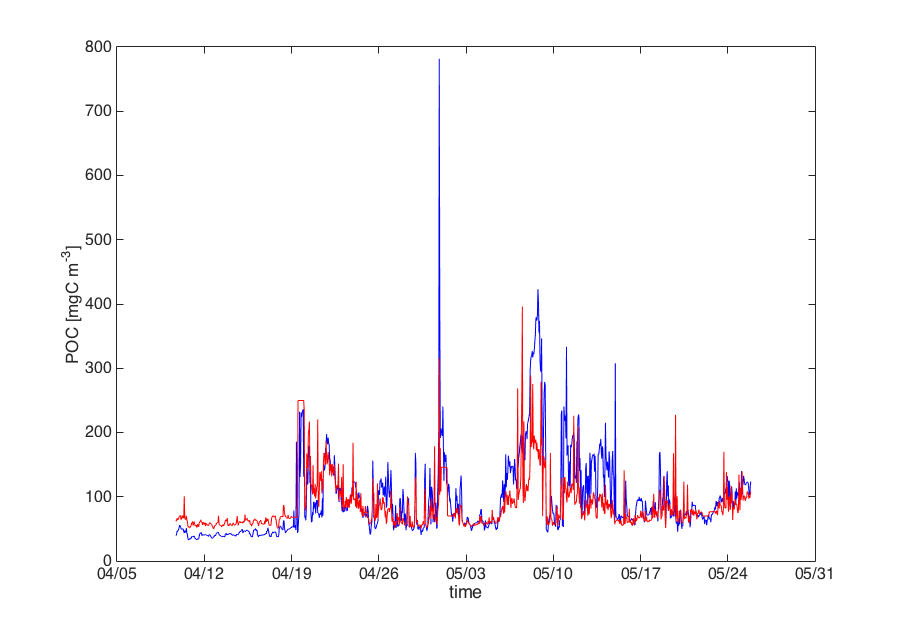 POC derived from AC-S (blue, 380 x cp650) and from the WETLabs fluorometer backscattering coefficient (red, 100 x 380 x bb).[/caption]
[/twocol_one] [twocol_one_last]
[caption id="attachment_10535" align="alignleft" width="500"]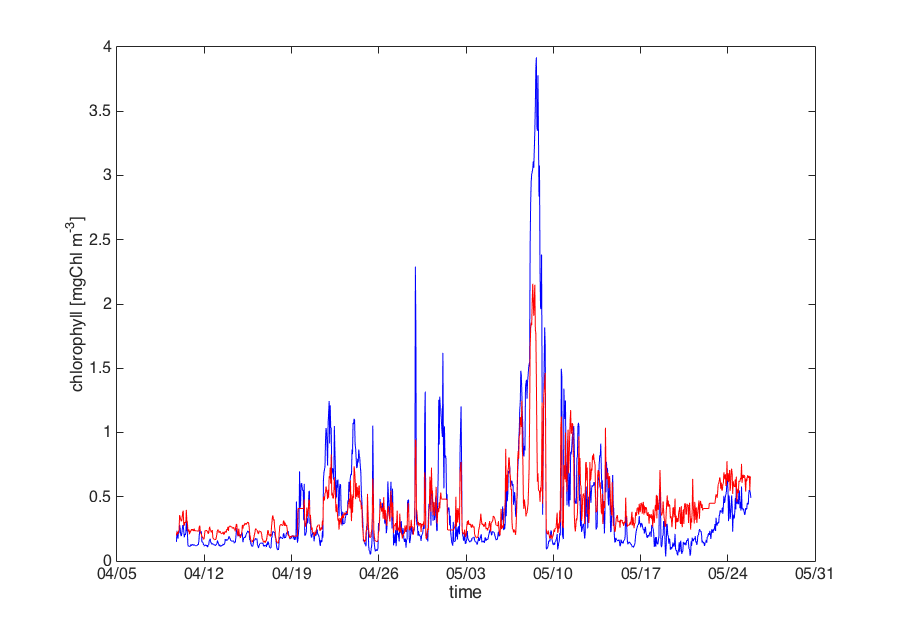 Chlorophyll based on AC-S (blue) and on a collocated WETLabs fluorometer (red, calibration x 0.5).[/caption]
[/twocol_one_last]
Dr. Boss stated “The fact that we can do this closure exercise gives me confidence that we should be able to see when fouling or drift become an issue.” He did caution that this analysis represented a very small data set at one location at a specific time, under limited ambient temperature and trophic conditions. “While very encouraging, much more work will need to be done to establish how representative it is,” he noted.
The data team is working on using these results to compare with the processed data being delivered by the OOI software, and are continuing to pursue similar efforts for additional instruments with the help of our other volunteer SMEs. We look forward to being able to tell similar success stories for other OOI instruments.
Read MoreOOI Status Update: Raw Data Now Available
Raw Data Access for all OOI Arrays is now available from the OOI Website, and can be accessed here.
Files within this page are organized using the following file hierarchy:
-
- Uncabled Assets: Site –> Deployment (e.g. D00001) –> Data Logger –> Instrument/Profiler
- Cabled Assets: Site –> Node
For help translating the directory structure, please refer to the list of Site-Platform Codes and Instrument Class Codes.
“Raw” indicates data as they are received directly from the instrument, in instrument-specific format. They may, depending on the instrument, contain data for multiple sensors (interleaved), be in native sensor units (e.g., counts, volts) or have some processing steps already performed. Some of the configuration files associated with the raw data streams are included with those data in the raw data repository.
Please note that though all OOI Raw Data are stored by OOI, they may be available through another website, such as the low-frequency hydrophones and seismometer data, which is available via the IRIS website.
OOI platform and instrument metadata and calibration data to supplement these raw data are accessible via the Asset Management page of the OOI Data Portal.
Additional information can be found on the Raw Data page. If you are not able to find what you are looking for or having any questions, please ask the HelpDesk.
Read More