
Posts Tagged ‘Regional Cabled Array’
Long-Term Monitoring of Gas Emissions at Southern Hydrate Ridge
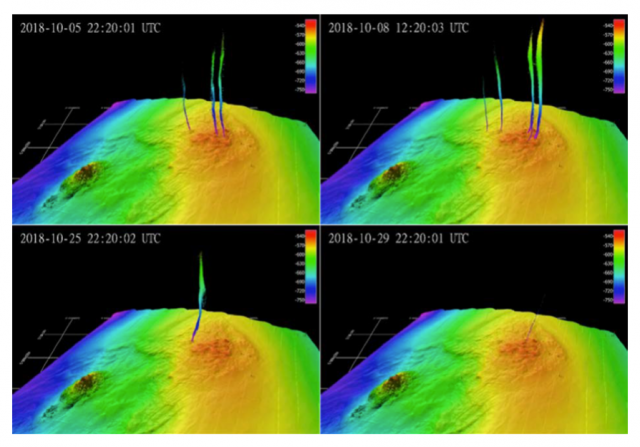
Identifying the parameters that control or influence seabed methane release is important to refining understanding of the carbon cycle. Data from the Regional Cabled Array are providing time-series required to quantify the flux of methane from the seafloor.
Read MoreDiscovery of Axial Seamount Deep Melt-Mush Feeder Conduit
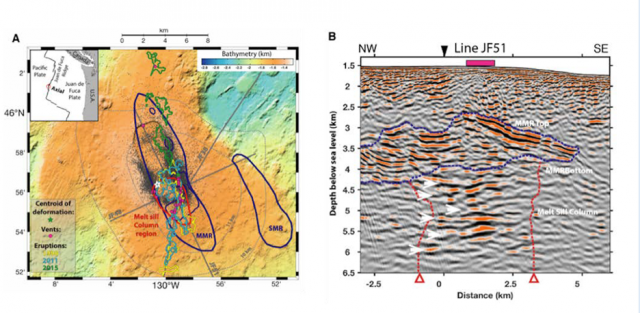
Recent observations at Axial Seamount provide new seismic images of the deep magma plumbing system, revealing a stacked sill complex beneath the main magma reservoir of this submarine volcano. The discovery of this deep melt-mush conduit at Axial, where long-term monitoring observations are supported by the Regional Cabled Array, is providing new understanding of magmatic systems on Earth.
Read MoreRCA Technical Wizards: The Saga of Repairing an RCA Primary Node
Chuck McGuire and Larry Nielson were able to take a cabled power and communications substation that sat inoperable on the dark, cold seafloor of the Pacific for two years and make it work again. The odds were against them. There’s usually less than a 50-50 chance to make a complex technology operational again after this length of inactivity – inactivity compounded by the extreme pressure, cold temperature, and biofouling that occurs on the bottom of the Pacific Ocean. But these two engineering geniuses succeeded in repairing, rebuilding, and ultimately reconnecting Primary Node 1B (PN1B), which provides power to the Southern Hydrate Ridge portion of OOI’s Regional Cabled Array (RCA).
[embed]https://vimeo.com/user110037220/pn1b[/embed]It was an arduous, complicated journey, fraught with delays outside of the engineers’ control. The recovery, repair, and reinstallation took two years to complete. We share some of the highlights below for they illustrate the many challenges of operating seafloor cable infrastructure on an active tectonic plate in the Pacific Ocean.
Chuck McGuire, a senior principal engineer, is the chief engineer for the RCA and principal investigator for the engineering portion of the RCA, which is conducted at the University of Washington’s Applied Physics Laboratory (APL). Larry Nielson is a field engineer three at APL. They have been working on the RCA project since its inception in 2009 (Construction and deployment began in 2013).
When PN1B failed in 2020, the duo was stymied at first. They had to call in a variety of people with different skills to recover, rebuild, and redeploy it.
“Restoration of the PN1B is really a testament to the engineering that went into these nodes, which are good and work well under very harsh conditions, “explained McGuire. The Primary Nodes were designed and built by L3 Maripro with oversight by the APL Engineering team.
A Cable Fault Causes Power Loss
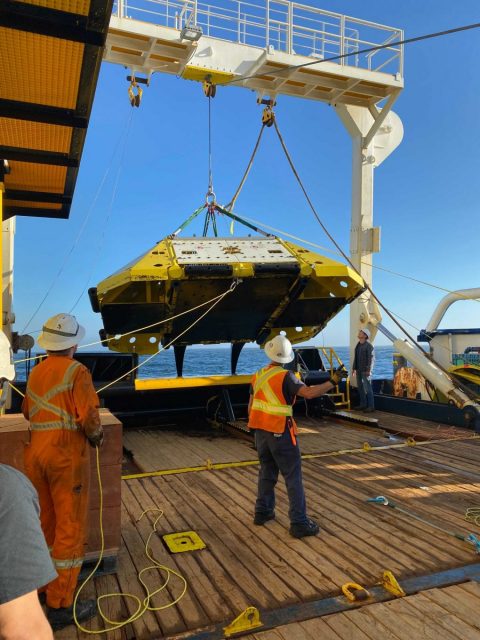
The saga began during RCA’s annual maintenance expedition in summer 2020. Everything was smooth sailing until suddenly the science team aboard the R/V Thomas G. Thompson learned of a cable fault on the southern cable line, which had shorted out. McGuire and team instantly went into troubleshooting mode and determined that the problem was in PN1B, which powers the Southern Hydrate Ridge section of the 900 kilometers of cable that comprise the RCA.
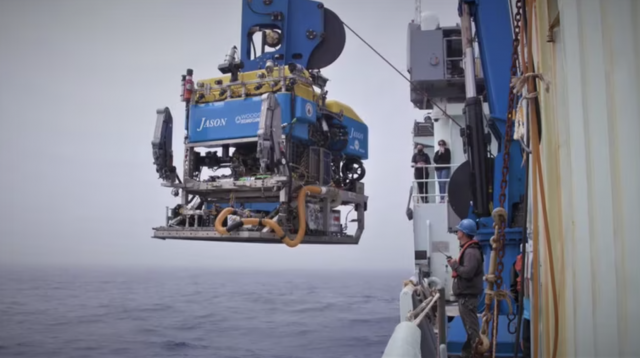
[media-caption path="https://oceanobservatories.org/wp-content/uploads/2023/03/202108-Recovery-of-Failed-PN1B-scaled.jpg" link="#"]Recovery of failed PN1B. Credit: NSF/OOI/UW.[/media-caption]Luckily, they were able to divert the ship, the R/V Thomas G. Thompson, to the PN1B location to investigate. McGuire was on shore at the Shore Station in Oregon where he could troubleshoot the power system. McGuire worked with a team onboard to use the Remotely Operated Vehicle (ROV) Jason, operated by the National Deep Submergence Laboratory of the Woods Hole Oceanographic Institution, to unplug and plug back in the science interface assembly (SIA) that provides power and communication to secondary infrastructure on the array (e.g. extension cables, junction boxes, instruments, and moorings). The SIA was attached to and powered by PN1B. The SIA wasn’t the cause of the short, so the next step was a visual inspection of the cable with the ROV, tracing the cables back from the node to see if there was any external aggression or damage to that cable. None was seen. The next step was to determine where the power was lost. By controlling the power from the Shore Station and sending “tones” (an oscillating frequency) down the cable, they were able to isolate the affected area. They determined that the PN1B was no longer transmitting any power to the southern cable line running east of the node.
McGuire and Nielson set to figuring out how to replace the damaged node with a spare. A specialized cable ship would be required. A request for proposal was released and the cable ship IT Integrity was secured.
With a cable ship lined up, the engineering team set about reconfiguring the Primary Node and a replacement SIA, which would be plugged into PN1B when both were back on the seafloor. The assembly was complicated and required reconfiguration of all the optics in the SIA’s interior. “Larry was able to get the SIA unassembled and rigged up in a way that made it possible for me to go in and remove and replace the components that needed to be replaced,” explained McGuire. “All of this was unexpected work, which took time, and there was much aggravation. But Larry had some amazing solutions to some interesting rigging problems.”
The two engineers had to rely on their experience to tear down the SIA and then reconstruct it. Their challenge included having to create specialized tools to get into extremely tight spaces. McGuire likened the work to repairing a car engine, where one slowly takes things off, working through the engine until finding the problem. The difference between the Primary Node and a car, however, was that spare parts to fix any issues found weren’t readily available and would have to be manufactured if needed. Here, again, the skill, experience, and tenacity of this duo were called into play. After taking the node apart and putting it back together again, they are now experts.
Their work was driven by a tight schedule needed to get the node and SIA ready for the next RCA recovery and deployment cruise in July 2021. The plan was to have the cable ship work simultaneously with the ROV Jason that was aboard the Thompson. During the 2021 expedition, Jason successfully unplugged and recovered the SIA. The cable ship Integrity then dropped a recovery line next to the node and Jason hooked the recovery line to the node. The cable ship recovered the node, returned it to the dock in Newport, where it picked up the replacement node. All seemed to be going well and on schedule.
While the transit and offloading were taking place, the team had tied the cables to a surface buoy to keep them accessible for reconnection to the new node. When back at the buoy, engineers on the Integrity began the process of jointing—essentially splicing—the tied-off cables and attaching them to new cables connected to the replacement node. When all was connected, the next step was to use a cable winch to lower the cables down to the bottom. Unfortunately, during deployment of the replacement PN1B, the system was damaged which resulted in a shunt fault. Tests indicated the damage was most likely in or very close to the cable termination assembly (CTA) making a repair with the node, at that time, not possible. The replacement PN1B was recovered to deck.
Rather than admit defeat, McGuire came up with the idea to bypass the replacement node and connect the cable downslope from the west to the eastern cable together to provide power and communication to Primary Nodes PN1C and PN1D. McGuire figured that if optical power was too high, communications would fail since PN1B would not be in the system to attenuate the signal. After a few quick calculations, McGuire determined what the attenuation needed to be in the line so that the power wasn’t too high to prevent communication down the cable. The required attenuators were driven down to Newport while the ship headed to port to retrieve the critical parts. The cables were then jointed with the attenuators in the optical circuit, restoring about 65 percent of the power and communications lost to the cable system initially and allowing RCA instruments and moorings at the Oregon Offshore and Oregon Shelf sites to become operational again. The maneuver was innovative and an engineering feat.
Upon returning to the lab, the team faced other challenges. They had to reverse engineer a CTA. Because many of the parts could not be seen without destroying other critical parts, a CT scanner was used to scan its many parts, and point clouds (discrete set of data points in space) were developed. These cloud points were then fed into Solidworks, a software program, to create models of each part that needed to be machined or refurbished.
“CTAs are a very complex component,“ explained McGuire. “They terminate a cable into an object that must retain its watertight integrity at over 3000 meters water depth, while withstanding 35,000 pounds of pulling force and protecting the optical fibers in the cable. Also, there’s not a rock solid on-land way to test its water tight integrity once it’s been built with the cable, ready for deployment.”
In getting ready for the next deployment attempt, the engineering duo encountered other obstacles from COVID-related delivery delays to manufacturers who no longer manufactured needed components. They persevered. The team tore down the replacement node a second time and rebuilt it, with the same deliberate process given the first replacement node. Once completed, they took the replacement node through a complete battery of tests, making sure that it was capable of being powered up, could communicate with the SIA, and provide power to the cabled system. They then shipped the node to Portland to be loaded on a larger cable ship, the C.S. IT Intrepid.
In June 2022, the replacement node was again ready for deployment. McGuire boarded the Intrepid with field engineer Paul Aguilar to oversee deployment. After two days of bad weather, the ship finally was on site. The deployment went without incident except that the node landed 400 meters short of where it was to connect to the cable. To reposition the node, PN1B would have to be lifted back on deck and four kilometers of cable would have to be “peeled” off the seafloor. This would greatly increase the risk to PN1B and the cable, so the team came up with the idea of essentially creating an extension cord to make the cables meet.
“The node was working, the whole system was working except we couldn’t plug anything into it yet, because it was too far away from where it needed to be,” said McGuire. “That was in the middle of June. We had until the end of July, (for the 2022 RCA recovery and deployment expedition) to acquire the parts, build an extension cable and come up with a plan to connect the two cable segments. “
As they do, McGuire and Nielson came up with a plan. By the July departure date, McGuire was aboard the Thompson to oversee the connection. Nielson was onshore to support logistics and attend to any contingent plans that might be needed. The deployment included coming up with a new rigging configuration that required hanging 500 meters of cable off the bottom of the Remotely Operated Platform for Ocean Sciences (ROPOS), a 40 hp Science/Work Class ROV operated by the Canadian Scientific Submersible Facility, using Yale grips every 100 meters or so to allow for proper positioning once the cable was on the sea floor. Using ROPOS, the team guided the end of the cable lit with a transponder and put the end right next to the Primary Node. They then “walked” the ship towards where the cable had to be plugged into the node, essentially laying out a long string in the water to the correct spot.
“And it worked on the first shot, which still amazes me today,” concluded McGuire. “I cried and went to bed.”
Read More
Axial Seamount Helping Scientists Forecast Eruptions
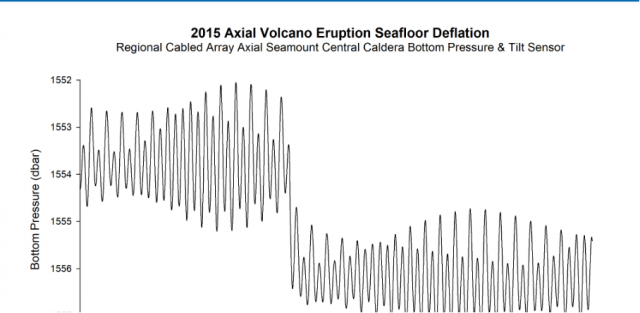
On March 20, 2023, Oregon Public Radio reported about scientists work at Axial Seamounts, a seamount and submarine volcano on the Juan de Fuca Ridge, about 480 kilometers off the coast of Oregon. The story details how bottom pressure recorders connected to OOI’s Regional Cabled Array are helping reveal the inner workings of the Axial Seamount and helping scientists forecast when it might erupt next. Featured are Oregon State University Professor Bill Chadwick, University of North Carolina Professor Scott Nooner, Oregon State University Assistant Professor Jeff Beeson, and College of Charleston Assistant Professor Haley Cabannis.
Access the article here.
Read MoreMaking the Ocean Accessible Through Sound
“Scientists are finding that people can sometimes pick up more information from their ears than the eyes can see. And ears can perceive patterns in the data that the eyes can’t see,” said Amy Bower, a Senior Scientist at Woods Hole Oceanographic Institution and Principal Investigator for the Accessible Oceans project. “Adding sound to science allows more people to experience science, follow their curiosity, and make science more accessible to all. “
Bower joined forces with a multidisciplinary team to explore ways sound could be used to visualize data. Funded by the National Science Foundation’s Advancing Informal STEM Learning Program, Bower and her team have been working for nearly two years on Accessible Oceans: Exploring Ocean Data through Sound. Their goal is to inclusively design and pilot auditory displays of real ocean data. They are implementing a process called sonification, assigning sound to data points. Each member brings expertise to the task at hand. Principal Investigator Bower is an oceanographer. Dr. Jon Bellona is a sound designer with specialization in data sonification at the University of Oregon. Dr. Jessica Roberts and graduate student Huaigu Li, both at Georgia Tech, are Learning Sciences and human-computer interaction experts. Dr. Leslie Smith, an oceanographer and specialist in ocean science education and communication at Your Ocean Consulting, Inc., rounds out the team. Bower is a blind scientist, who lends a crucial perspective in the research and overall execution of the project.
To begin, the team chose to use datasets collected by the Ocean Observatories Initiative (OOI) that had previously been transformed into classroom-ready use by Smith and the Ocean Data Labs. The team is working first on three of these curated datasets: the 2015 eruption of Axial Seamount, the vertical migration of zooplankton during an eclipse event, and carbon dioxide exchange between the ocean and the atmosphere.
“Data is made of numbers. Sonification is basically just translating numbers into sound,” Bower explained. “So instead of seeing numbers go up and down on a graph, for example, you can hear them go up and down.”
To ensure an inclusive final product, the team has undertaken a co-design process in which a variety of stakeholders have been engaged for input throughout the process. The team interviewed both subject matter experts and teachers of the blind and visually impaired to ensure that both scientific and pedagogical needs were being met. They then explored the integration of various auditory display techniques and ended up with a mix of data sonification, narration, and environmental sounds. The team put together a sample of five to six sonification examples for each data set, then surveyed a group of blind, visually impaired and sighted adults and students with science and non-science backgrounds. The survey’s purpose was to ask which sounds and which approaches might work best for both sighted and visually impaired listeners.
“We asked, for example, which of these sounds do you think best represents gases coming in and out of the ocean. The feedback was overwhelmingly in favor of a breathing sound,” said Bower. “As listeners will hear in the first example below that deals with carbon dioxide exchange between the ocean and the atmosphere, the breathing sound, with narration explaining what to expect, really brings the data to life.”
Accessible Oceans is a pilot and feasibility study for a museum exhibit that would introduce the broader public to what it’s like to experience ocean data through sound. At the end of this two-year project, the team intends to submit another proposal to design and build an exhibit that make ocean data come alive in a new and accessible way.
“As we’ve been working on this project, we’ve come to realize that to engage more people in science, technology, engineering and math, we can appeal to their ears as well as their eyes,” added Bower. “And I’m determined to help make science as accessible as possible for everyone.”
________________________________________________________________________
To hear more about Amy Bower’s work as an oceanographer and her exploration of sonification, tune into this episode of The Science of Ocean Sounds, Tumble Science Podcast for Kids.
Read More
Visit to West Coast OOI Facilities
A group of Ocean Observatories Initiative (OOI) leaders visited OOI facilities at Oregon State University and the University of Washington last week to get a first-hand look at operations of the Coastal Endurance Array and Regional Cabled Array, respectively. National Science Foundation Program Director George Voulgaris, OOI Principal Investigator Jim Edson and Senior Program Manager Paul Matthias spent five days on the road meeting with their OOI west coast colleagues. The trip was designed to give recently appointed Voulgaris an opportunity to inspect the infrastructure and meet team members who keep the Coastal Endurance and Regional Cabled Arrays operational and reporting back data around the clock. Edson and Matthias seized the opportunity to meet in person with colleagues who they routinely see on the screen.
The following provides a glimpse of some of the activities that occurred during the trip:
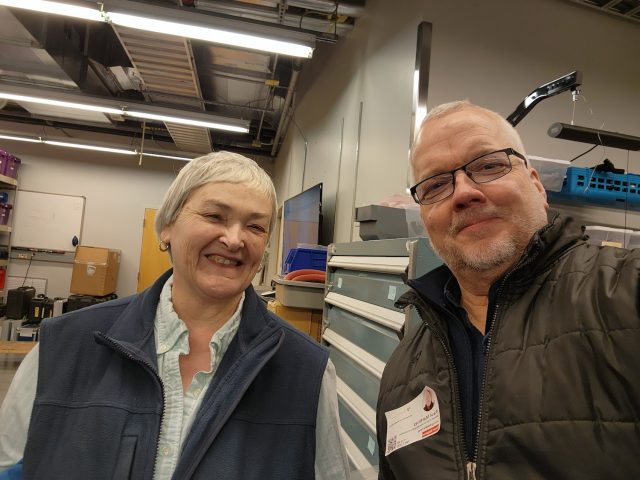
[media-caption path="https://oceanobservatories.org/wp-content/uploads/2023/02/20230207_140014.jpg" link="#"]Grant Dunn, Mechanical Engineer with the Electronic & Photonic Systems Department at UW-APL (left) describes the level-wind system on the RCA profiler mooring to Dr. George Voulgaris during a tour of the RCA laboratory facilities at the University of Washington as RCA Project Manager Brian Ittig looks on. Credit: Paul K. Matthias © WHOI.[/media-caption] [media-caption path="https://oceanobservatories.org/wp-content/uploads/2023/02/20230207_144911.jpg" link="#"]Regional Cabled Array Principal Investigator Deborah Kelley (left) and OOI Senior Program Manager Paul Matthias take a selfie to commemorate their in-person visit during a tour of the RCA facilities at the University of Washington. Credit: Paul K. Matthias © WHOI.[/media-caption] [media-caption path="https://oceanobservatories.org/wp-content/uploads/2023/02/20230207_141656.jpg" link="#"]NSF Program Director George Voulgaris (from left), OOI Principal Investigator Jim Edson look on as Regional Cabled Array technicians Grant Dunn, Mechanical Engineer with the Electronic & Photonic Systems Department at UW-APL, and RCA Chief Engineer Chuck McGuire explain the engineering associated with the RCA profiler mooring during a tour of RCA’s facilities at the University of Washington. Credit: Paul K. Matthias © WHOI.[/media-caption] [media-caption path="https://oceanobservatories.org/wp-content/uploads/2023/02/20230209_123758.jpg" link="#"]NSF Program Director George Voulgaris (left) asks OSU technician Jonathan Whitefield questions about glider operations that provide critical water column data around the moorings of the Coastal Endurance Array. Credit: Paul K. Matthias © WHOI.[/media-caption] [media-caption path="https://oceanobservatories.org/wp-content/uploads/2023/02/20230207_112718.jpg" link="#"]NSF Program Director George Voulgaris (foreground) and RCA Chief Engineer Chuck McGuire discuss the RCA data monitoring systems as OOI PI Jim Edson points to real-time data on the screen being relayed by instrumentation on the Regional Cabled Array. Credit: Paul K. Matthias © WHOI.[/media-caption] [media-caption path="https://oceanobservatories.org/wp-content/uploads/2023/02/20230209_130353.jpg" link="#"]NSF Program Director George Voulgaris (left) gets a hands-on look at the multiple instruments contained on multi-function node that will sit on the bottom of the ocean floor for six months collecting data for the Coastal Endurance Array. Coastal Endurance Array Principal Investigator Ed Dever (middle) and Project Manager Jonathan Fram the functionality of each instrument during the visit to Oregon State University. Credit: Paul K. Matthias © WHOI.[/media-caption]
Read More
RCA and ROPOS: A Long-Term International Collaboration
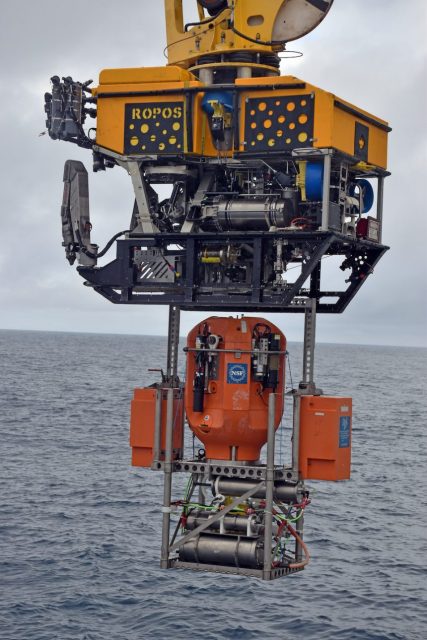
A Canadian and American team worked side-by-side for 45 days in August in the NE Pacific Ocean during the eighth operations and maintenance expedition for OOI’s Regional Cabled Array (RCA). The team used the Canadian remotely operated vehicle (ROV) ROPOS to conduct maintenance operations on RCA’s underwater cabled observatory spanning the Juan de Fuca Plate and at water depths from 80 m to 2900 m. Intense operations included the recovery and reinstallation of 222 instruments and a 2700 m-tall, two-legged Shallow Profiler Mooring. This expedition took place on the global class research ship the R/V Thomas G. Thompson, operated by the University of Washington (UW). Twenty-six students joined the cruise as part of the UW at-sea experiential learning program called VISIONS.
ROPOS is operated by the Canadian Scientific Submersible Facility (CSSF). The vehicle was specially designed for cabled observatory work, bringing in components from the oil and gas field, and a uniquely designed Remotely Operated Cable Laying system (ROCLS) that allows the vehicle to install extension cables extending for several kilometers on the seafloor. Their work culminated in 2014 during an 83-day cruise onboard the R/V Thompson, which resulted in the installation of >15,000 m of extension cables (in total, ~33,000 m of extension cables was installed on the seafloor), >140 instruments, and platforms on the six-state of-the art moorings with instrumented profiling vehicles. They also installed 18 junction boxes at the key experimental sites using their underbelly latching system that allows the vehicle to directly secure loads up to 4,000 lbs beneath the vehicle. This latching system was adopted by the Deep Submergence Facility ROV Jason, which has conducted multiple RCA maintenance cruises.
[media-caption path="/wp-content/uploads/2022/12/R2209_20220812_091705_launch_ME.Axial-Base_Science-Pod_install-2.jpg" link="#"]The Shallow Profiler Science Pod being deployed with ROPOS during Leg 1 of the RCA 22 cruise at Axial Base. Credit: M. Elend, University of Washington, V22.[/media-caption]
During this latest expedition, ROPOS conducted 60 dives over 33 at-sea days. Keith Tamburri led seven members of the ROPOS team, who worked 12 hours on, 12 hours off for 45 days. Operations are more similar to industry with as little time on deck as possible for the ROV, typically about three hrs before ROPOS reentered the water. Team work is exemplified during ROPOS operations where two pilots each operate a manipulator to conduct complex operations. The ROPOS team was joined in the dive control laboratory by varying members of the RCA’s team, who directed ROPOS activities on the seafloor and throughout the water column, and the VISIONS’22 students who stood 4 hour watches. (A list of ROPOS and RCA team members can be found here).
During this 8th RCA recovery and deployment expedition, the R/V Thompson traveled to all of the RCA sites. ROPOS recovered and redeployed a diverse array of instruments and four small seafloor substations that provide power and communications to instruments on the seafloor and to the instrumented Deep and Shallow profiler moorings. The ROV also was used to install a 500 m long extension cable that allowed bringing the Southern Hydrate Ridge live again. ROPOS also recovered equipment and samples for externally funded principal investigators, including several novel instruments developed by scientists in the US and Germany. ROPOS tasks were many and varied. The vehicle emplaced packages up to 3200 lbs in weight and the pilots skillfully used the manipulators to do everything from scrubbing biofouling off cables to unplugging and plugging in instruments to the seafloor cable
In addition to RCA operations, ROPOS was used to help advance scientific investigations involving instruments added onto the RCA cabled network. For example, as part of an Early Career award to for Dr. Rika Anderson at Carleton College, ROPOS conducted sampling dives using a Universal Fluid Obtainer on the ROPOS porch to sample fluids for follow-on analyses of microbes and viruses. Through another NSF award to Dr. Wilcock and his UW colleague Dana Manalang, ROPOS installed a first of its kind acoustic network on the western and eastern rim of Axial Seamount and within its caldera to examine deformation within the caldera. A suite of CTD instruments were also turned within the caldera to test the hypothesis that brines are emitted from the subsurface associated with submarine eruptions as part of and NSF award to Dr. William Chadwick at the Oregon State University. Lastly, ROPOS inspected a Quantification sonar and recovered an Overview Sonar on Southern Hydrate Ridge as part of a project funded by the German Federal Ministry of Education and Research to MARUM at the University of Bremen, led by investigators Gerhard Bohrmann and Yann Macron. In addition, their 4K high-definition camera was cleaned and a CTD turned. The sonar and camera instruments are another example of an international collaboration.
“Our ROPOS team really enjoys working with the team from the University of Washington, School of Oceanography and Applied Physics Laboratory, who are responsible for the RCA. They are a professional, well-organized, efficient, friendly, and mutually respectful group, which makes these long missions at sea productive, efficient, and successful,” said Keith Shepherd, General Manager, Canadian Scientific Submersible Facility. “And for this cruise, in particular, it was a real pleasure working along with UW undergraduates onboard as part of UW’s at-sea experiential program VISIONS. The students brought a curiosity, enthusiasm, and energy that were always welcome during the long hours in the dive control van.”
Added Kelley, “It really takes a tremendous amount of time, effort, and teamwork to pull off an expedition of this length and complexity. We are grateful to have had the opportunity to work again with our Canadian colleagues. It was an excellent international collaboration to help maintain and expand the capabilities of the RCA. “ Because of the complex nature of the undersea work required to keep the RCA operational, few facilities are trained and equipped to execute such operations.
[media-caption path="/wp-content/uploads/2022/12/ROPOS-ROCLS_IEEE-copy-2.jpg" link="#"]ROPOS with the cable laying system ROCLS attached during the 2014 deployments of the extension cables. Credit: M. Elend, University of Washington, V14.[/media-caption]
Read More
Nature Review Paper Reveals New Understandings of Mid-Ocean Ridge Systems
Only a small percentage of the global seafloor has been investigated, leaving the deep ocean as one of the last frontiers to be explored and sampled. Mid-ocean ridges (MOR) systems extend about 60,000 kilometers around the globe, are where 70% of the volcanism on Earth occurs, and are dynamic and active tectonic regions.
A recent Nature Review paper, Früh-Green, et al. 2022, written by a multi-disciplinary team of experts summarizes what is known about MORs, their importance in regulating seawater chemistry and global chemical fluxes, and the diverse ecosystems that they support in the absence of light and under extreme conditions. The authors describe the tectonic, magmatic, and hydrothermal processes that govern how they form and change and describe some of the biogeochemical cycles at varying spreading rates.
“The first hydrothermal vent was discovered in 1977, which was followed by myriad discoveries about these amazing deep-sea environments over the next 45 years,” said OOI’s Regional Cabled Array Principal Investigator, Deborah Kelley at the University of Washington and an author of the paper. “Yet, much remains to be understood about these environments, which play a key role in regulating seawater chemistry and global chemical fluxes. Key unknowns include the evolution of the novel microbial communities that they host and the diversity of viruses. This paper summarizes some of the key discoveries that researchers have made and questions that remain to be answered.”
Among the paper’s key findings are:
- Spreading rates control variations in heat sources, magma input, and tectonic processes along MORs, providing multi-faceted habitats for life.
- Seawater circulation and hydrothermal alteration regulate seawater chemistry and change the composition and physical properties of the lithosphere (crust and upper mantle).
- Roughly 50-60% percent of global MORs are spreading at slow to ultraslow rates resulting in the exposure of lower crustal and upper mantle rocks. This spreading is creating asymmetric ridge segments that support different structures, hydrothermal processes, and vent fluid chemistry.
- Serpentinization decreases density and seismic velocities of mantle rocks, weakening the oceanic lithosphere along faults. Serpentinization also produces hydrogen and organic molecules that provide energy for microbial life.
- Unlike serpentinizing systems, basalt-hosted systems support a vast, hot and diverse microbial biosphere. Advanced technologies are allowing better characterization of the genetic makeup and metabolism of microbes and the role of viruses in shaping biodiversity.
- Hydrothermal processes govern global chemical fluxes of magnesium, iron, manganese, and other volatiles and provide nutrients to the deep ocean. Microbial interactions and oxidation of organic compounds within hydrothermal plumes produce organic carbon.
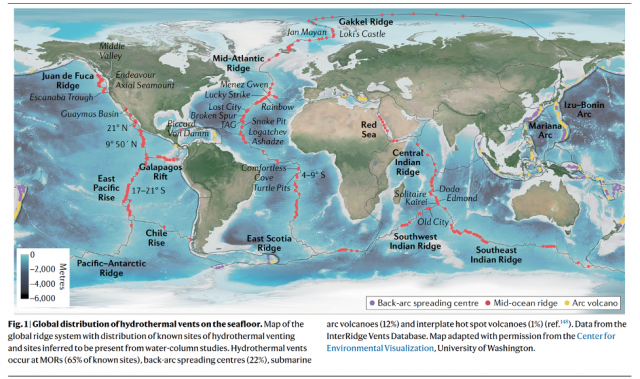
[media-caption path="/wp-content/uploads/2022/11/Screen-Shot-2022-11-29-at-10.54.32-AM.png" link="#"]Global distribution of hydrothermal vents on the seafloor. Map of the global ridge system with distribution of known sites of hydrothermal venting and sites inferred to be present from water-column studies. Hydrothermal vents occur at MORs (65% of known sites), back-arc spreading centers (22%), submarine arc volcanoes (12%) and interplate hot spot volcanoes (1%). Data from the InterRidge Vents Database. Map adapted with permission from the Center for Environmental Visualization, University of Washington.[/media-caption]
“Ocean observatories like OOI’s Regional Cabled Array and Ocean Networks Canada , are providing researchers unprecedented real-time views into these highly dynamic regions that help form the face of our planet,” added Kelley. “RCA has allowed researchers to measure and monitor activity at the magmatically robust Axial Seamount, on the Juan de Fuca MOR for example, providing insights into when it might next erupt. Such underwater observatories will only continue to advance our knowledge as we expand capabilities to observe, monitor, and sample seafloor environments and the overlying water column in real time with more sophisticated sensors and advanced underwater vehicles and robotic technologies.”
Reference:
Früh-Green, G.L., Kelley, D.S., Lilley, M.D. et al. Diversity of magmatism, hydrothermal processes and microbial interactions at mid-ocean ridges. Nat Rev Earth Environ (2022). https://doi.org/10.1038/s43017-022-00364-y
Read More
An Overview of Ambient Sound Using OOI Hydrophones
Adapted and condensed by OOI from Ragland, et al., 2022, doi.org/10.1121/10.0009836.
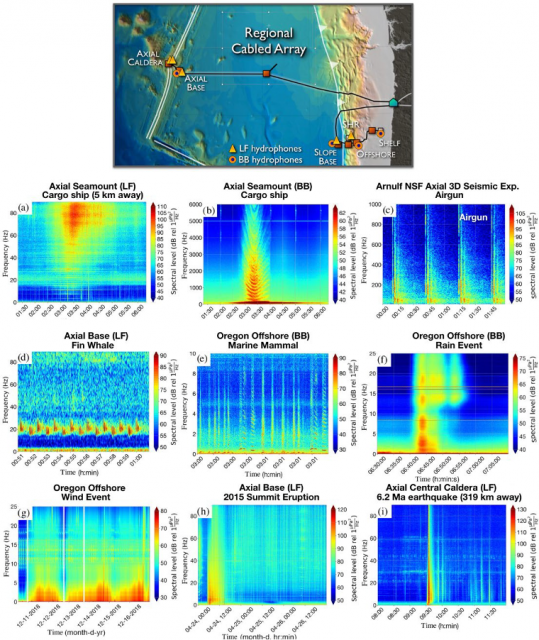
[media-caption path="/wp-content/uploads/2022/11/RCA-highlight.png" link="#"]Figure 1: Highlights of acoustic features from the five low frequency (Fs=200Hz) and six broadband (Fs = 64 kHz) hydrophones on the RCA.[/media-caption]Ragland et al., (2022) provides a wonderful overview of the unique opportunities for data and experimentally driven advancements in acoustics that are provided by (long-term) ambient sound recordings streamed live from hydrophones on the Regional Cabled Array. Figure 1, above (after Figure 5, Ragland et al., 2022), highlights acoustic features from the five low frequency (Fs=200Hz) and six broadband (Fs = 64 kHz) hydrophones on the RCA. Areas of research span the rare ability to conduct offshore monitoring of Fin whale migration, and the seasonal fluctuations and decade-long evolution of their calls, in situ offshore meteorological measurements with high temporal resolution to study wind and rain noise in the NE Pacific, the sound from commercial ships with impacts on the oceanic environment and marine life, ambient noise interferometry, volcanic eruptions, and both local and far-field earthquakes. As the authors note, the RCA-OOI data also provide significant opportunities for the development of machine learning tools for ocean acoustics. This work was supported by an award from the Office of Navy Research. The authors developed a public Python package (OOIPy) to access and explore the hydrophone data more easily (Schwock et al., 2021). OOIPy is also accessible through the OOI website tab Community Tools and Datasets.
__________________________________________________________
Ragland, J., F. Schwock, M. Munson, and S. Abadi (2022) Journal of the Acoustic Society of America, 151, 2085-2100, https://doi.org/10.1121/10.0009836.
Schwock, F., J. Ragland, L. Setiawan, M. Munson, D. Volodin, and S., Abadi (2021). OOIPY v1.1.3: A Python toolbox designed to aid in the scientific analysis of Ocean Observatories Initiative data, https://doi.org/10.5281/zenodo.5889288.
Read More
Student Videos Give Inside Look at Research and Safety
Four students from Queens College were aboard the R/V Marcus G Langseth for a recent ten-day research expedition to the Axial Seamount, a submarine volcano in the northeast Pacific Ocean that erupted in 1998, 2011, and 2015. The students were assisting a National Science Foundation Research team that is deploying autonomous ocean-bottom seismometers on OOI’s Regional Cabled Array as part of a two-year experiment taking place within the predicted time window of the next eruption.
The NSF-funded project is led by William Wilcock from the University of Washington and co-led by Felix Waldhauser, Columbia Climate School’s Lamont-Doherty Earth Observatory, who served as chief scientist on this expedition, Maya Tolstoy (UW), and Yen Joe Tan from the Chinese University of Hong Kong, who also was onboard.
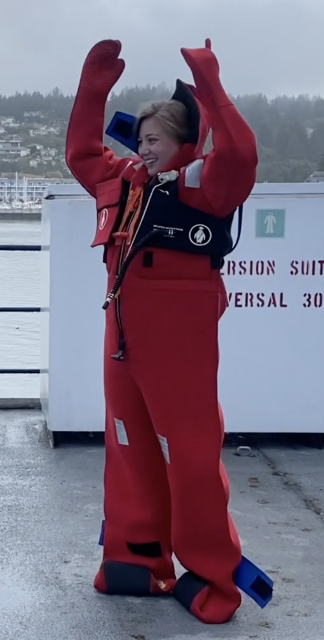
Queens college graduate student Jacqueline Singer was onboard to further work towards her master’s degree. She teamed up with undergraduates Rania Taib, Hema Muni, and Julia Sandke to create two videos – one explains their research, while the other provides an insider’s look at safety issues at sea. In the first video, the students give an in-depth look at how they deployed 15 autonomous ocean-bottom seismometers and how they work. In the second video, the students explain the importance of survival suit training, followed by a humorous look at the complex movements needed to successfully suit up in a “Gumby suit.”
Columbia University PhD candidate Theresa Sawi also provides a written account of the expedition here.
https://vimeo.com/user110037220/studentsataxialseamount
https://vimeo.com/user110037220/gumbysuitdemo
Read More