
Posts Tagged ‘Regional Cabled Array’
45 Days of Discovery: RCA’s 8th O&M Expedition
The Regional Cabled Array (RCA) team left port in Newport, Oregon on August 5 aboard the global class research ship the R/V Thomas G. Thompson for a 45-day expedition. This is the eighth operations and maintenance cruise to the array, a network of 900 kilometers of electro-optical cables that crosses a tectonic plate and powers sensors on the seafloor and in the water column, including instrumented profiling platforms on moorings.
The expedition is such a complex operation that it will be conducted in five legs, with the ship returning to Newport to offload recovered equipment and load new and refurbished equipment for a subsequent leg. A scientific and engineering team of 26 from the University of Washington will be joined by an engineering team of 8 that will operate the remotely operated vehicle ROPOS, owned by the Canadian Scientific Submersible Facility. These groups will be joined by 28 students from the University of Washington, participating in the at-sea-experiential learning program, VISIONS, which provides undergraduate students opportunities to conduct research at sea using advanced oceanographic research instruments.
[media-caption path="/wp-content/uploads/2022/08/Thompson-leaving-dock.-FZqU5VxUYAAWUie-scaled.jpeg" link="#"]The R/V Thompson as it left the dock in Newport and headed towards the OOI Slope Base site for the first dive of this 45-day expedition. Credit: NSF-OOI/UW/V22.[/media-caption]There will be a live feed video for the duration of the expedition. “During the cruise, website visitors will be able to directly observe parts of the seafloor rarely seen by humans, including the most active submarine volcano off our coast ‘Axial Seamount’ located ~300 miles offshore and nearly a mile beneath the oceans’ surface,” said Deb Kelley, principal investigator of the RCA. “ Visitors will be able to witness one of the most extreme environments on Earth – underwater 700°F hot springs teaming with life that thrive on volcanic gases and that live in the complete darkness of the deep sea. The team will also visit the Cascadia Margin, spending time at Southern Hydrate Ridge where methane ice deposits are sometimes exposed on the seafloor. This hummocky, sediment-rich environment hosts a large number of areas where methane gas seeps from the seafloor feeding dense microbial mats that also host large clams. ROPOS will also visit shallower sites that are some of the most biologically productive areas in the world’s ocean.”
The 45-day expedition required an immense logistics operation with ~20 trucks transporting >130,000 lbs. of gear to Newport. During the cruise, the ROV will deploy and recovery a diverse array of >200 instruments, several small seafloor substations that provide power and communications to instruments on the seafloor and on moorings that span depths of 2900 m (9500 ft) to 80 m (260 ft) beneath the oceans’ surface. In addition, several novel, externally funded instruments developed by scientists in the US and Germany will be installed.
Follow along as the journey unfolds: Live video feed. Student Blog. Expedition updates.
Read More
Using Aircraft Expertise for Underwater Operations
Regional Cabled Array (RCA) Engineer Eric McRae came to the RCA Team with a 20+ year background keeping aircraft in the air, cars on the road, and medical devices safe. McRae worked on a Head-Up display and skid control and braking systems on some large commercial aircraft that are flying now. He also worked on a popular pacemaker/defibrillator for a medical instrument company. As a result of this experience, and long-term work in automotive engine control, McRae brought with him a mindset about correct behavior of control software to the RCA. He simply will not accept anything that is misbehaving. In the past, people’s lives were at stake, now it’s possible interruption of data collection or loss of scientific equipment.
McRae adopted his approach to help design and keep operational the Shallow Profilers on the RCA moorings which must work correctly for a year at a time in the cold, dynamic, and sometimes hostile, waters of the Pacific Ocean. The Shallow Profiler houses 10 scientific instruments and includes a winch that pays out power and communication cable allowing the science pod to rise through the water column to a depth below the surface determined by currents and wave conditions.
“I think that the Cabled Array Team is successful because many of us came from industries where it was not acceptable to produce something that could fail,” McRae explained. “We use this same mindset to figure out ways to make things work and keep them working even under the most difficult of circumstances.”
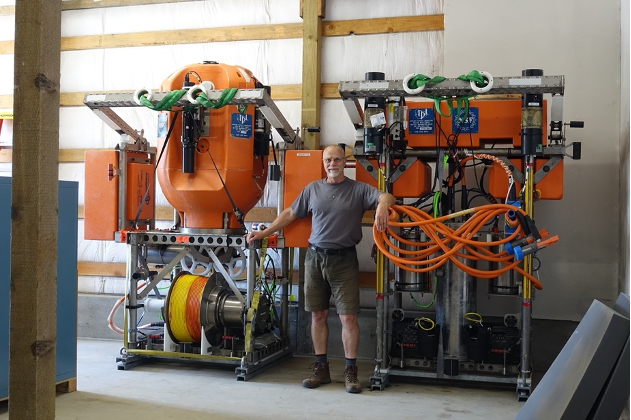
[media-caption path="/wp-content/uploads/2022/07/eric-selfie.png" link="#"]RCA Engineer Eric McRae stands with the components of one of the RCA Shallow Profilers that he programmed to successfully move up and down the water column in the Pacific since 2014. Photo: McRae.[/media-caption]From his first days at the RCA, Gary Harkins, his boss at the time, told McRae that his job was to make sure the Shallow Profiler was safe. “Safety was the top priority — not science, or anything else. Once we were sure the profiler could be operated safely, we could accomplish whatever the science mission wanted.” Initially, McRae worked with Dr. Doug Luther and Dr. Kendra Daly to understand how the science team wanted the profiler to run. Once he understood the science requirements, he worked with RCA’s mechanical designers to understand how they wanted to design the mechanical aspects of the system.
McRae then used his experience to influence the design and created a viable electronic control system that supports communications that keep the winch running and its science pod node traveling up towards the surface and back down nine times a day. A winched cable provides continuous power and communications to the science pod, allowing science and engineering data to flow to shore in real time. The mechanical design and control system have kept the Shallow Profiler operational since its launch in 2014.
[embed]https://vimeo.com/733359478[/embed]The control system continually “talks” to the winch and science pod to assess movement through the water. Near the bottom, the science pod doesn’t move very much, except for an occasional tilt caused by currents. As it gets close to the surface, however, surface waves can have a huge impact on how the profiler moves and how much tension is on the cable. The science pod weighs ~900 pounds in air so when it gets moving back and forth underneath waves, it could significantly stress the cable. To prevent this from happening, the science pod “reports” three times a second to the control system about the conditions it is experiencing. These reports include acceleration, rotation, proximity to the surface, wave length, and a slew of other variables so that needed adjustments can be made automatically to keep the winch and ultimately its valuable science pod “safe.” If conditions warrant, the control system has the capability of aborting a running profile and/or parking the science pod near the mooring to wait things out.
The Shallow Profiler is often on the move. Each of the nine daily profiles take between one and a half to two and a half hours, depending on the profile type and ocean conditions. There’s a gap of about 30 to 45 minutes between profiles, where the science pod is parked down near the mooring platform. During that time, the controller is constantly monitoring the waves on the surface. McRae developed an algorithm to look at the worst-case peak to trough wave pressure so that when the profiler starts up for a run towards the surface, it has already calculated what it thinks the worst wave height combination will be. The original requirements of the system were that the science pod can go no closer to the surface than five meters or three wave heights, whichever is greater, so when it starts up, it already knows the ceiling for the coming profile.
“As designed, the profiler is smarter than we are. It makes seven decisions three times a second to ensure that it is on the right path and has accounted for all predictable conditions” McRae said.
Of course, there are other hazards besides ocean conditions. In September of 2017, a trawler’s net hit the mooring line at the Oregon Offshore site and eventually the mooring platform itself, pulling the 14,000-pound mooring and its two huge anchors from the seafloor. The profiler was running at the time and recorded the action until the boat pulled hard enough that the seafloor cable came unplugged. There has also been a smattering of mechanical issues, but the system has matured nicely. Should something unexpected go wrong in the future, McRae has programmed the profiler to take “evasive” action, then notify him and his team on land. This performance record demonstrates that not only did McRae’s work help keep the profiler safe, it helped make it a reliable component of the RCA that scans through the water with ease. The three profilers have made >40,000 profiles since 2015, making unprecedented measurements of ocean parameters.
Read More
Trina Litchendorf: A Wealth of Sea-going and Engineering Experience
Trina Litchendorf is a highly experienced member of the Regional Cabled Array (RCA) team with a wealth of sea-going and engineering experience. She’s been with the Applied Physics Laboratory (APL) at the University of Washington (UW) since 2001. She started there as an intern through a NASA sponsorship, and stayed on while getting a degree in chemical oceanography at the UW. After graduation, she remained at APL, where she has been involved in keeping ocean observing instrumentation operational ever since. She has been working specifically on RCA instruments since 2013. She was onboard for the first deployment of cabled array instrumentation in 2014, and has served as a key part of every annual expedition since.
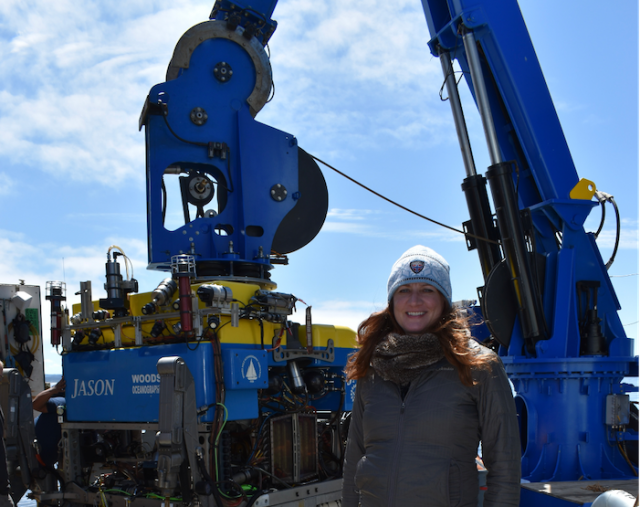
[media-caption path="/wp-content/uploads/2022/06/Trina-1.png" link="#"]Trina Litchendorf in front of the ROVJason. Credit: University of Washington.[/media-caption]
Trina’s duties at APL and for the RCA vary by the season. During the spring and early summer, she is actively engaged in testing and building RCA components so that they are ready for the annual Operations and Maintenance cruise. These cruises usually take place in August when undergraduate students join RCA team members at sea as part of the VISIONS at-sea experiential learning program to recover and deploy the infrastructure and instruments that the cable powers.
Each instrument undergoes three rounds of testing. The first is in the winter after the recovered instruments have been refurbished. Each is put through a rigorous round of testing, with a 12-page document of things to check. These procedures cover everything from checking for ground faults to prevent instruments from shorting out in saltwater, to placing them in a large salt water tank to simulate deployment conditions to ensure they work under such conditions. The instruments are also put through a pressure test to simulate seafloor conditions, followed by full functionality testing.
The second and third tests happen directly before the annual cruise and prior to deployment. “The second test is an integration test in the lab. We attach the instruments on the platforms on which they will be deployed to make sure that we can communicate with them and operate them through the platform. Once this test is complete, we are ready for the third, which happens onboard the ship during the annual expedition.” Onboard, she conducts a final test, connecting to the platform again to make sure all the instruments are working before anything goes into the water. She also is ready with spare and replacement parts should anything go awry during this final test.
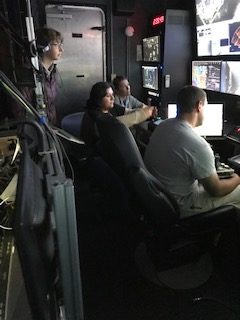
During the expedition, Trina also directs remotely operated vehicle (ROV) dives, which serves as the eyes, ears, and hands of the underwater operation. She sits in the “hot seat” next to the ROV pilot where she directs activities on the seafloor and in the water column. The pilot manipulates the ROV to execute myriad complex operations she directs. Every platform is a little different so it is necessary to follow a prescribed dive plan to make sure every task is completed in the order in which it is supposed to happen. The complexity of these dives makes for some long days. “Typical dives run anywhere from 3-12 hours or more, and I usually end up pulling one or two 24-hour days while I’m at sea.”
“We have to get all of our gear on the seafloor plugged in and operational and last year’s gear up and off the seafloor,” Trina explained. “We have so much equipment that there’s not enough deck space for all of it, so we break the cruises up into multiple legs to load the next batch of equipment and offload the recovered gear. As a result, these cruises last anywhere from five to six or more weeks.” She’s currently getting ready to depart on VISIONS 22 in August, which because of its scope, is six weeks long and will be conducted in five legs.
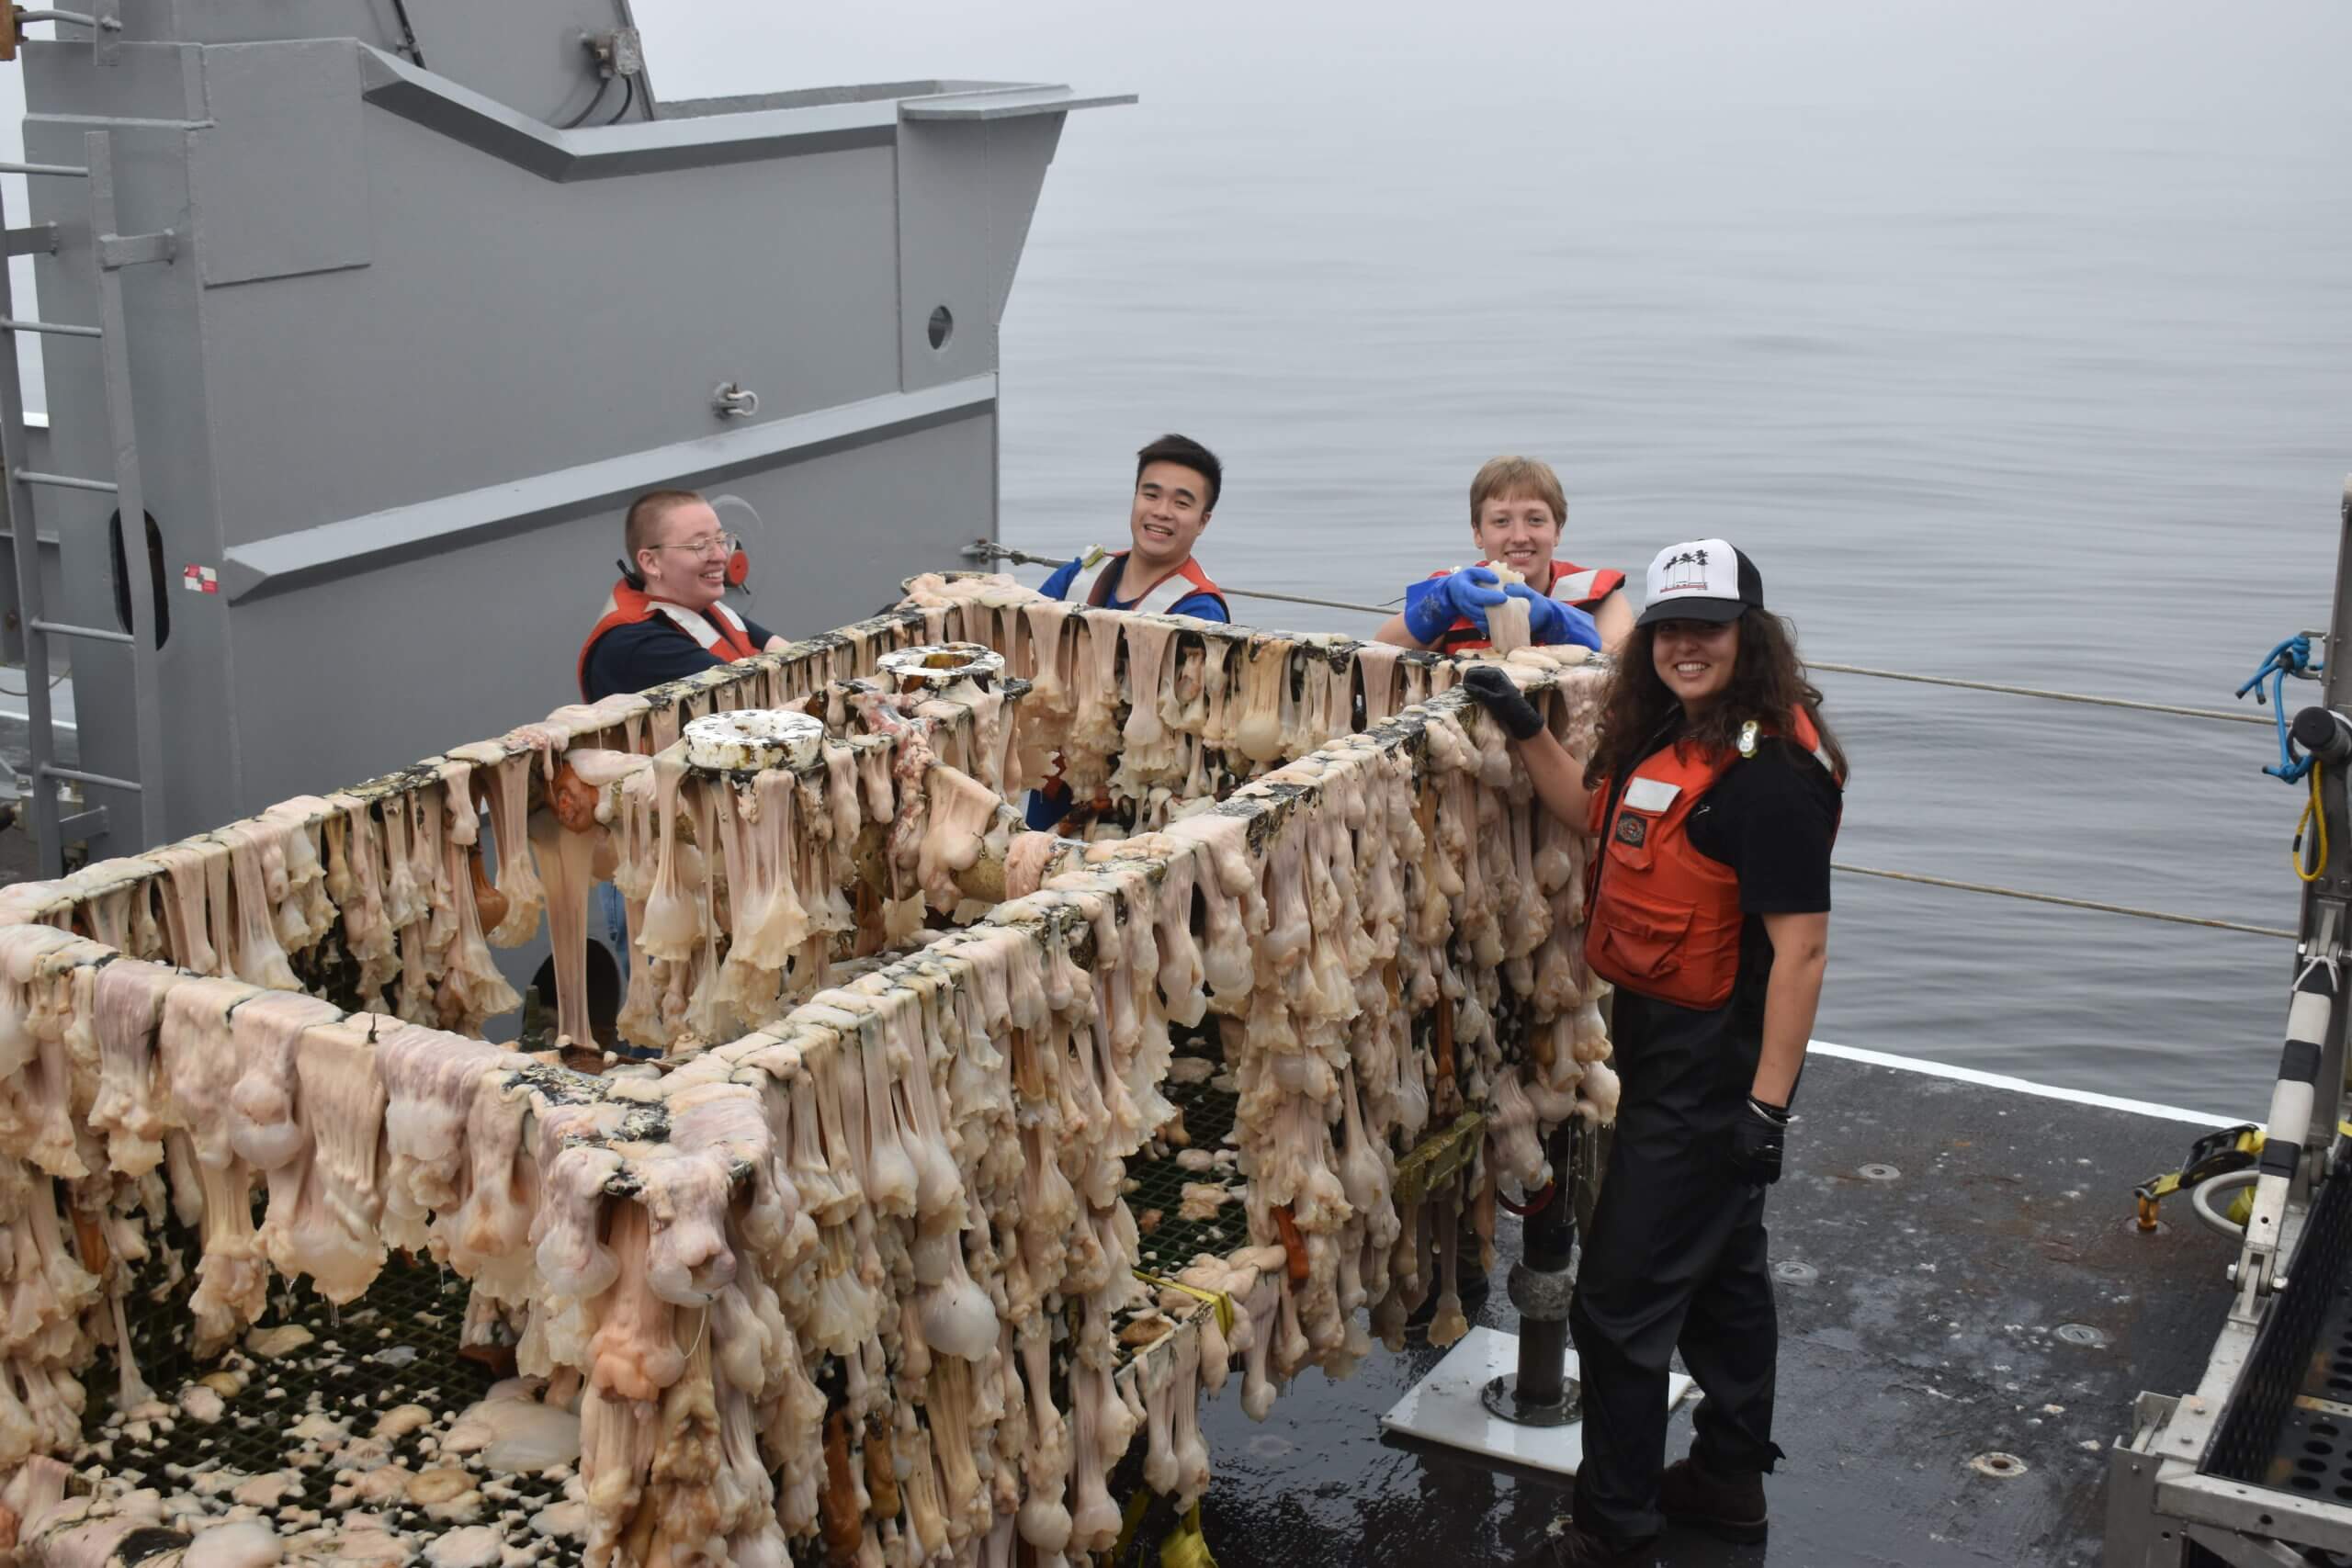
Once recovered, another of her jobs is to photograph the platform and instruments’ condition, before helping with clean up, scraping of sea life that has colonized instruments and platforms, and removing a years-worth of additional biofouling.
[media-caption path="/wp-content/uploads/2022/06/students_20190622_171924_working.jpg.jpg" link="#"]Chris Williams, an undergraduate student at UW, helps to clean off a bioacoustics sonar package heavily covered with barnacles and anemones. Credit: UW/VISIONS’19/NSF/OOI.[/media-caption]
In the fall, after the cruise is over, Trina’s responsibilities turn to refurbishment and readying the instruments their next deployment. This, too, is a big job. There are close to 150 instruments deployed on more than 30 different types of platforms. The platforms range from junction boxes on the seafloor that serve as power sources for many instruments to benthic experimental packages with their own suite of instruments to shallow and deep-water profilers that move instruments up and down through the water column to sample at various depths. Her task is to ensure that recovered instruments are cleaned, taken apart, and refurbished. Most of the instruments are sent off to vendors for refurbishment and recalibration. The ultimate objective is to ensure that all of the instruments are working and that high quality data are being streamed from the RCA for community use.
The winter, into spring is spent testing and putting the platforms and instruments back together again in preparation for the upcoming cruise as the cycle begins again.
Trina’s favorite part of her job is her time at sea, particularly the time she spends in the control van with the ROV team. There she also runs the science camera, which gives her an inside look into a world few others have the opportunity to see. “I’m seeing things that most people only get to see on the Discovery Channel or National Geographic. It really is a great privilege to be part of that.”
And, she sees the cabled array as a vision realized. “I remember Dr. John Delaney telling us (during one of her undergraduate oceanography classes) about this idea he had to put a large cable in the water to power multiple seafloor sensors to study the ocean and that the whole paradigm of how oceanographic research was conducted was going to change. He saw it as moving from the old model of going out to sea on research vessels for just a few weeks at a time to collect data, to having a 24/7 365–day presence on the seafloor and throughout the water column streaming data in real time to scientists all over the world. And here I am now, actually doing this work and helping this science happen. It’s amazing,” she concluded.
Read More
Distributed Acoustic Sensing Lays Groundwork for Earthquake, Tsunami Warnings, and More
Researchers using the OOI Regional Cabled Array are at the forefront of testing Distributed Acoustic Sensing (DAS) along the seafloor through funding from the National Science Foundation. Ocean-bottom DAS using submarine fiber optic cables promises to advance what we know about marine geology, offshore earthquakes, ocean currents, ocean waves, sediment transport, marine mammals, and a host of other activities that now can be measured by this revolutionary technique.
Taking advantage of a rare temporary shutdown of RCA’s submarine fiber optic cables during a shore station maintenance period, University of Washington Researcher William Wilcock and California Institute of Technology (Caltech) Graduate Student in Geophysics Ethan Williams were part of a team of scientists who installed DAS interrogators on RCA’s “dark cables” to test and collect data for a community experiment. The experiment was designed to determine the potential of submarine DAS to observe seismic, oceanographic, acoustic and geodetic processes. Each interrogator transmitted laser pulses down the fiber optic cable from RCA’s shore station and across the offshore Cascadia Margin and recorded the echoes that came back. This backscatter remains constant until some movement on the bottom or in the water column perturbs the fibers in the cable, changing the pattern of backscattered light. By rapidly probing the cable hundreds of times per second, DAS allows researchers to monitor what’s happening in the cable environment.
“Using DAS, the fiber optic cable acts, in effect, like a line of seismometers that can measure the stretching and contracting of the ground, “explained Wilcock. “It’s an amazing technology, similar to going out in the field and putting a seismic instrument every 10 meters for a stretch of 100 kilometers. So it’s just astounding in terms of what it can potentially measure,” said Wilcock.
The DAS system also has the capability of measuring other oceanographic signals. “It turns out that ocean bottom acoustic sensing on these fiber optic cables is as sensitive to the water layer above as it is to the solid Earth below. This sensitivity provides all sorts of really interesting signals that you would normally observe using an ocean bottom pressure sensor. DAS is opening up the door for lots of interesting research opportunities,” said Williams, who has been working with DAS systems for years under the supervision of Zhongwen Zhan at Caltech, one of the world’s foremost experts in the field.
Among the many potential ways DAS data might be used include advancing earthquake and tsunami early warning systems, and understanding wave and current action, sediment transport, and ocean-generated seismic noise, as well as providing biological information. In Wilcock’s case, he’s excited about using DAS to gain access to fin whale calls that were picked up by this DAS experiment.
The National Science Foundation funded this experiment in the hopes of developing protocols that can support the use of DAS for science and hazards mitigation in the Northeast Pacific while meeting national security requirements. The U.S. Navy conducted a preliminary review of the data and subsequently released the data for public use. The data are being stored on RCA servers at the University of Washington. Researchers will have ftp access to the data at this link. But because the full data set is 26 terabytes, researchers can also email ooicable@uw.edu to arrange to provide disks that will be returned with data they are interested in.
Four days of continuous measurements in this dynamic offshore environment also offer a potential treasure trove of data. Graduate student Williams is turning his attention to exploring these datasets and calibrating them against conventional measurements to better understand what some of the potential applications may be. “I’m very excited about the potential DAS brings to understanding what’s happening on the seafloor. Having, in essence, so many seismometers on the ocean floor means that we can apply all sorts of array-based processing so we’re not only averaging in time, we’re combining information in space. And this allows a lot of really innovative things that we weren’t able to do before.”
“But the real value of these datasets comes from being an open dataset. It will be a great facilitator for learning with the potential to expand general knowledge about how to use DAS in the marine geology and marine geophysics world, which is great,” Williams added.
Both Wilcock and Williams were excited about the potential for DAS to open up understanding of the processes involved in this deep-sea world. They both mentioned a dream of having DAS sensors integrated into future SMART cable technology to expand DAS use on land and in the sea.
Read More
Axial Seamount Continues to Reveal Its Secrets
Adapted and condensed by OOI from Chadwick et al., 2022, doi:/10.1029/2021GC010153.
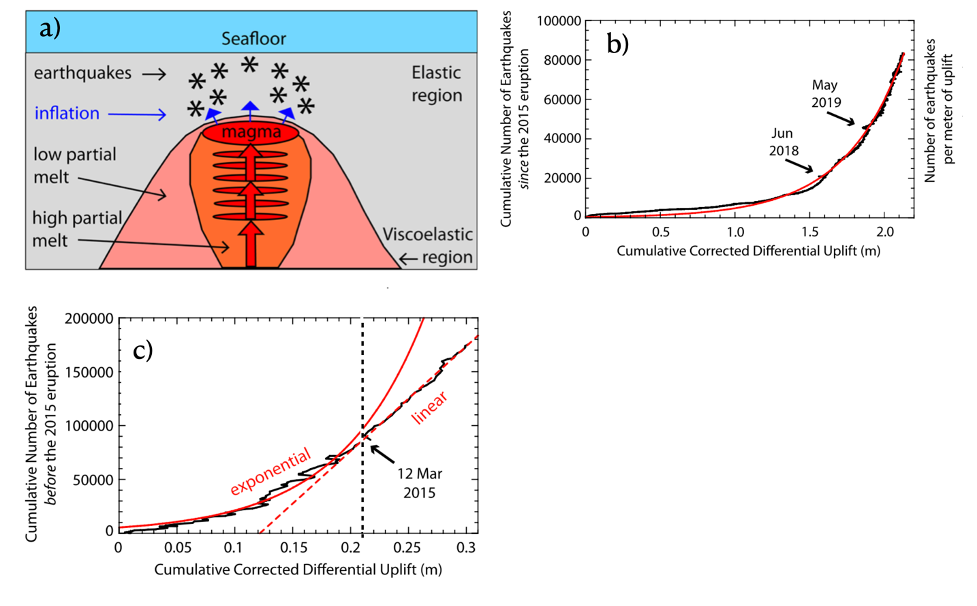
Axial Seamount is the longest monitored mid-ocean ridge volcano, providing new insights into the relationships among magma supply, uplift-deflation behavior, and seismicity leading to and follow eruptions. Results are as summarized here.
[media-caption path="/wp-content/uploads/2022/02/Axial.png" link="#"]a) Cross section cartoon showing shallow magma chamber beneath Axial fed by a series of stacked sills. Upward migrating of melt through the sills results increases pressure in the shallow chamber causing uplift and associated earthquakes. b) Exponential increase in earthquakes per meter of uplift since the 2015 eruption. c) Earthquakes per meter of uplift before March 12, 2015 follow an exponential increase, while post this day earthquakes follow a linear trend leading up to the April 24, 2015 eruption. (After Chadwick et al., 2022; Figures 6 and 13).[/media-caption]The magma supply rate has changed significantly over periods of months to years. Since the 2015 eruption, the summit of the volcano has been inflating at a decreasing rate. This re-inflation was punctuated by eight discrete short-term deflation events occurring over 1-3 weeks, approximately every 4-6 months from August 2016 to May 2019. These deflation events were coincident with an abrupt decrease in seismic activity, which did not pick up until reinflation resumed. In contrast, the long-term monitoring indicates that there was a surge in magma supply between 2011 and 2015, resulting in the two eruptions closely spaced in time.
Although the summit of the volcano has inflated 85%-90% of its pre 2015 eruption level, the geodetic and seismic monitoring suggests that the magma supply rate has been waning since 2015, pushing the forecast for the next eruption out 4-9 years. The data since 2015 also show that the deformation and seismic activity are tightly coupled, showing an exponential increase in seismic activity per unit of uplift. A significant conclusion from this study is that the transition from an exponential to linear increase in seismic activity to total uplift may indicate impending crustal failure between the shallow magma chamber and the seafloor. In concert, these results may lead to more refined forecasting of future eruptions of this highly active volcano and the testing of hypotheses concerning the short-term deflation events.
__________________________________________________________
Chadwick, W.W., Jr., W.S.D. Wilcock, S.L. Nooner, J.W Beeson, A.M. Sawyer, and T.-K. Lau (2022) Geodetic monitoring at Axial Seamount since its 2015 eruption reveals a waning magma supply and tightly linked rates of deformation and seismicity. Geochemistry, Geophysics, Geosystems, 23, e2021GC01053.
Read MoreApplications Open for June Northeast Pacific OOIFB Workshop
The Ocean Observatories Initiative Facility Board (OOIFB) will host a workshop focusing on current and future science that can be addressed using data from OOI’s infrastructure in the Northeast Pacific and other regional observatory arrays. The workshop will be held at the OSU Portland Center in Portland, OR on June 7-9, 2022. This workshop was scheduled to be held in 2020, but was postponed due to the COVID-19 pandemic. The OOIFB is hopeful that in June 2022 members of OOI’s community can safely come together for a productive workshop. A hybrid model with in-person along with options for virtual participation is planned.
The workshop is aimed at researchers who are using or are considering using OOI data; resource managers from national, state, and tribal agencies; and educators at all levels interested in using data from the OOI’s Regional Cabled, Coastal Endurance, and Global Station Papa Arrays.
The workshop will inform the research community of the available data and science opportunities offered by the OOI and other observatory arrays located in the Northeast Pacific. An overview of OOI data products, user interfaces, and system features will be provided along with hands-on demonstrations using data access tools. OOI Program Team members and NSF representatives will be on hand to answer questions and provide information on OOI operations.
The workshop will provide a forum to facilitate science collaborations, identify strategies for engaging future users of OOI, and build cross-network collaborations. Community-building and expanding broader impacts will be discussed. Workshop participants will have the opportunity to provide feedback on their experiences in working with the OOI systems and data.
To apply for the workshop, please complete the on-line application form that is available on the workshop web page. Please indicate how you plan to participate in the workshop (in person or virtual) when completing the form. Travel support is available, but limited. Broad representation from institutional, geographic, and disciplinary groups is desired and will be considered in participant selection. The deadline for applications is March 20, 2022.
Additional details about the workshop and agenda are available here.
Two Artists at Sea
Two artists were aboard the R/V Thomas G. Thompson during this summer’s OOI Regional Cabled Array VISIONS’21 cruise. Undergraduate student Genevieve Kent was leaving the Thompson for Leg 1 of the four-week cruise. Professional artist and lifelong learner, Catherine Gill, was was onboard for Legs 3 and 4 of the summer expedition, including an extra two days at sea while the Thompson was diverted for a rescue mission of two Ocean Exploration Trust remotely operated vehicles (ROVs).
While their physical paths didn’t cross aboard the ship, each spent their time similarly while onboard – serving as a member of the scientific party, taking regular shifts to ensure samples were collected and underwater footage from the ROV Jason was catalogued and archived. They also spent whatever free time they had capturing their experiences in creative endeavors.
Catherine Gill
Because of space limitations on the ship, Gill came equipped with only those supplies that would allow her to draw and paint in very limited space. As a plein air painter, Gill has painted everywhere from in a kayak to in the forest canopy, so she knew what kind of supplies she would need. She brought with her the basics – a standing tripod easel and a small palette. She also brought with her a very small kit that she could keep on her lap and create 5×7 paintings.
“It’s very busy on these legs, but whenever I could find an hour, maybe an hour and a half, I would find a spot on the ship. And I’d set up and do paintings of whatever was happening, putting the new profiler in or pulling up the old one, or capturing some of the very cool stuff on cameras being broadcast by the ROV Jason,” she said. “’I’m sitting there in the Jason control van and watching these scenes that are amazing. There’s different sea life coming from all over the place. The ROV lands on the bottom and you see chimneys and all of the amazing sea life that is down there. It was just incredible.”
Gill painted as things unfolded aboard the Thompson and took screen shots of Jason scenes so she would have a point of reference later on. Regional Cabled Array Principal Investigator Deb Kelley also provided Gill with Jason video that Gill took home to her studio to create bigger paintings of the sea life and Jason operations after she left the ship.
But Gill recounted that she was most at home aboard the ship, painting the experience in real time in “plein air.”
“Because I paint on location, not just from photographs, I know there’s a real difference when you paint from life than when you paint from a photograph. The marks you make are more convincing. If you feel the cold, if you’re aware of the silence, if the wind is blowing on you, you give your painting more than just what your eyes can see,” she explained. But I couldn’t get down to the seafloor to actually paint on location, so having access to video is the next best thing. Having high-definition video to paint from, I can get the feel of what that weird fish is doing, better understand the complexity of those tube worms and deep-sea critters all moving and doing their things, and watch that hydrothermal vent smoking and interacting with the seawater.”
Gill created 13 drawings and paintings while onboard. After her return, she has created another eight to 10 larger-scale paintings. More of her work can be seen on her website, Instagram, and Facebook (Catherine Gill).
Genevieve Kent
Kent, a third-year undergraduate student studying marine biology at the University of Washington, merged her passion for marine science with her artwork while aboard the Thompson. Her interest in marine science was sparked during a seminar class on hydrothermal deep sea vents taught by Kelley. Kent took advantage of the opportunity to participate in a shipboard experience that she learned about in this class to see if she really wanted to pursue a career in marine science.
Kent was accepted to participate in VISIONS’20, but student participation was postponed until 2021 due to COVID restrictions. So, she jumped at the opportunity to sail on the Thompson a year later as part of the VISIONS’21 student contingent.
Her favorite part of the experience was doing shifts in the control van, where her job was to log everything that was happening with Jason as it was used to recover and deploy equipment plugged into the Regional Cabled Array. “I really liked being able to be a part of what was happening. It reminded me a lot of when I was a stage manager for live theater, being in the hot seat and you have to know your role in everything. But it was also really amazing to watch the monitors in real time and see all that was happening there, live and being a part of it.”
Kent works in many mediums from water colors to acrylic paints, to markers, but for this project she chose water colors because they fit the theme of the ocean and can help evoke its many changing moods. While Kent is not a professionally trained artist, she is naturally talented. She used her time in the control van to sketch with colored pencils and capture images of marine life on the bottom that she painted when she returned to her in-home studio.
Once home from the cruise, Kent immediately sat down and started to capture her experiences in watercolors. She used her sketches and images as source material. She is spending as much time as possible on her artwork, as she resumed classes and labs as a full-time student. She has completed several paintings of marine life and has many others in varying stages of completion. Kent can be contacted here.
Plans are in the works to have both artists show their creations at an exhibit at the University of Washington later this spring. A sneak preview is provided below:
[gallery size="large" ids="28987,28988,28989,28990,28991,28992,28993,28994,28995,28996,28997,28998,28999,29000,29001"]
Read More
RCA Recording Swarm of Earthquakes in Real Time

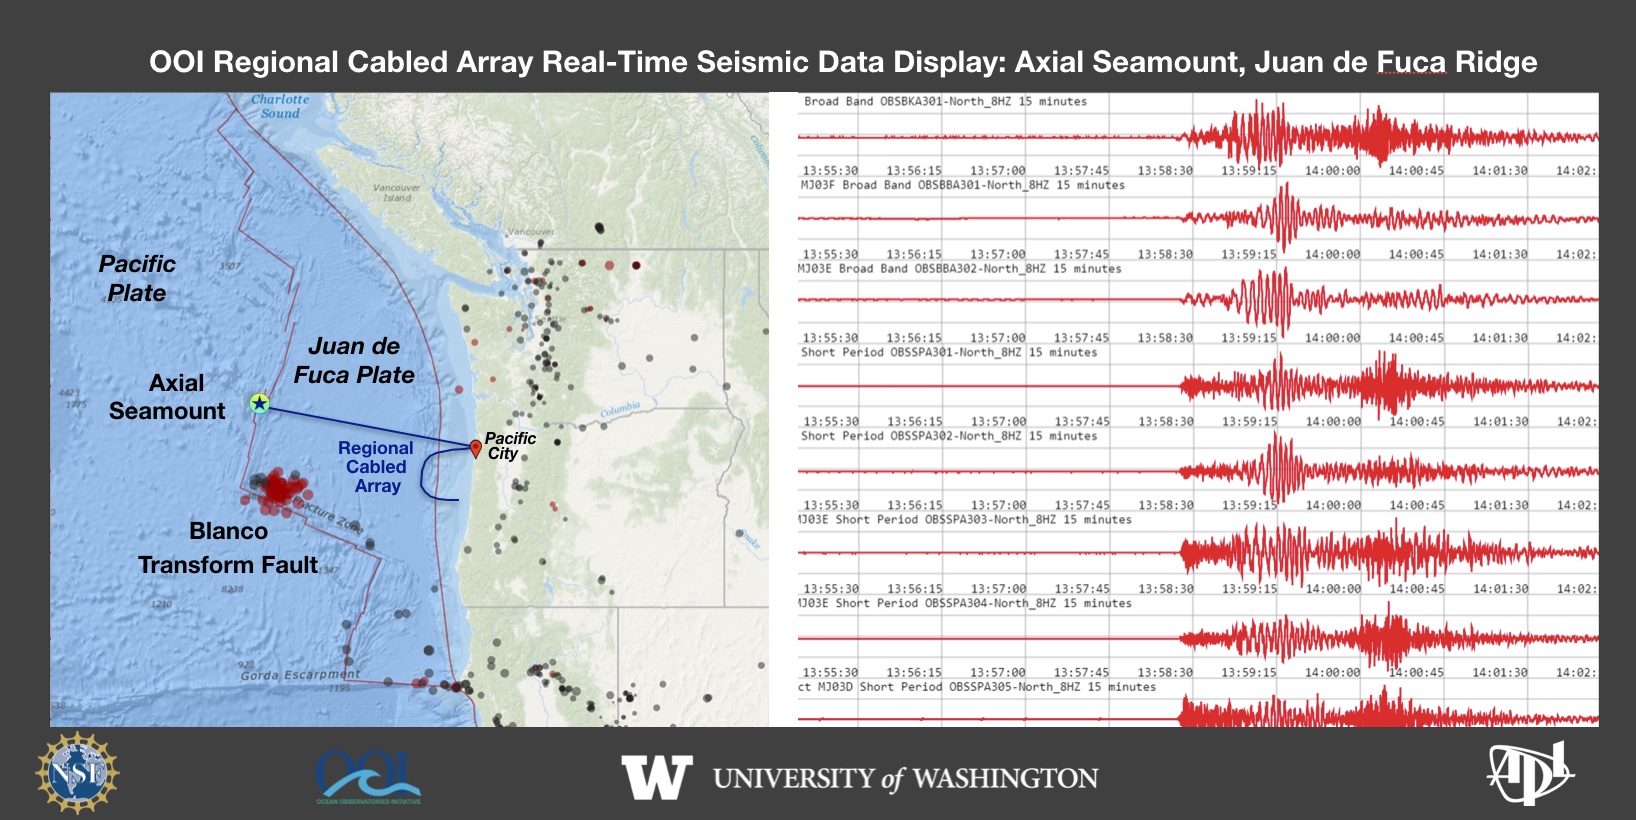 On December 7, 2021 a swarm of earthquakes began on the Blanco Transform Fault, a major plate boundary at the southern end of the Juan de Fuca Plate. The ongoing seismic swarm is being tracked live by the National Science Foundation’s underwater observatory, the Regional Cabled Array (RCA). The RCA is a component of NSF’s Ocean Observatories Initiative and is operated and maintained by the University of Washington. It includes ~900 km of high power and high bandwidth submarine fiber optic cables that stretch from Pacific City, OR out to the most active volcano off the coast “Axial Seamount” that erupted in 1998, 2011 and again in 2015. A second cable heads south along the Cascadia Subduction Zone and turns east along the Cascadia Margin off Newport, OR. Over 150 instruments on the seafloor and on instrumented moorings provide real-time data flow to shore at the speed of light. A suite of seismometers at the summit of Axial Seamount lit up on December 7, 2021 as the seismic swarm began along the Blanco. This live feed was developed by the UW Applied Physics Laboratory.
Read More
Katie Bigham: From VISIONS Student to Co-Chief Scientist
Katie Bigham feels like her journey with the Ocean Observatories Initiative (OOI) has come full circle. She first visited Axial Seamount as a University of Washington (UW) School of Oceanography undergraduate participant on the Regional Cabled Array (RCA) VISIONS 2014 program when the underwater observatory was being installed. This summer, she returned to Axial Seamount on her seventh cruise, this time as a Co-Chief Scientist.
[media-caption path="https://oceanobservatories.org/wp-content/uploads/2021/10/Katie_V15_byLauren_DSC_0069.sm-copy-scaled.jpg" link="#"]Katie Bigham on the R/V Thomas G. Thompson. Credit: L. Kowalski, University of Washington, V15.[/media-caption]Katie was excited to step into the role of Co-Chief Scientist on the fourth leg of the annual RCA operations and maintenance cruise (VISIONS’21). She previously participated in many other roles on the ship and was looking forward to a new challenge sailing as a Chief Scientist aboard a global class research ship.
Her responsibilities as Co-Chief Scientist included much planning and communication during the round-the-clock operations and numerous remotely operated vehicle dives. “It’s really about keeping everybody who’s invested in the voyage up to date, from the RCA team itself, to the Captain and crew, to the VISIONS’21 students, to the RCA team shore-side,” she says. Katie credits the success of leg four to the OOI RCA team aboard the R/V Thomas G. Thompson and strong shore support. “I felt well-supported in my first time as Co-Chief, and that helped me step up to the challenge,” she says.
Katie says the coolest part of being on the cruise was working with recent UW graduate Katie Gonzalez. She met the younger Katie when she went to visit her school for an outreach event in the far western reaches of the Olympic Peninsula and later mentored her in the lab for a year. “To see her very confidently and competently prepping the osmotic fluid samplers and then sharing with the ROV pilots what the goals of the installation dive were, and what was needed for this instruments deployment within and active vent site was really cool,” she says.
Katie Bigham grew up as the granddaughter of a commercial fisherman and spent a lot of time on the water, but she didn’t know that oceanography was something people studied until high school, when she interned with an oceanography graduate student at UW. The lab was very welcoming to her, and she attended the lab’s summer barbecues and dissertation defenses in between her work helping to culture Arctic bacteria.
After that experience, Katie initially wanted to study geology at Arizona State University, but she decided to stay closer to home and attend UW instead. When she remembered how welcoming the oceanography lab was, she decided to take oceanography classes, and that’s when things started coming together. Early in her college career, Katie took Dr. Deb Kelley’s hydrothermal vents class and came away from it wanting to see the underwater hot spring environments in person and work with Dr. Kelley and the OOI team.
“Deb bringing me onboard as a VISIONS student and then mentoring me through that process was what helped me know I wanted to stay in oceanography,” Katie explains. “I was really inspired by her research and her work with students, and I’d really like to continue in academia because of her influence. I wouldn’t be doing the things I’m doing without all her support.”
[media-caption path="https://oceanobservatories.org/wp-content/uploads/2021/10/20210903_100228_01-scaled.jpg" link="#"]VISIONS’21 Leg 4 students and participants. Credit: M. Elend, University of Washington, V21.[/media-caption]Katie is currently pursuing a joint PhD at the Victoria University of Wellington and the National Institutes of Water and Atmospheric Research in New Zealand. She is continuing with deep-sea science, researching the impact of turbidity currents, or underwater landslides, on benthic communities living in submarine canyons. This work builds on some of the work she did for her undergraduate senior thesis mapping megafauna at methane seeps along the RCA. Katie hopes that her research will be helpful for management of marine protected areas in New Zealand and inform about impacts in other marine canyons, such as those on the Cascadia Margin.
Katie returned to Washington from New Zealand during the COVID-19 pandemic. She has been able to continue her writing and data analyses while abroad from an office within the RCA space. Ironically, thanks to the pandemic, she was able to participate in this year’s RCA cruise.
After she obtains her PhD, Katie hopes to continue her research as a postdoc. “I would really like to bring what I’ve learned during my PhD and my experiences with the RCA back together,” she comments. “I’d love to do a postdoc working with RCA data.”
[embed]https://youtu.be/_YOsgNNLOP8[/embed]
Katie Bigham also played an instrumental role in the production of this video that was a project for the VISION’14 class. It was selected as one of the top ten videos in a nationwide contest sponsored by the Florida Center for Ocean Sciences Education Excellence. The video has been viewed by nearly 38,000 student judges in 1,600+ classrooms in 21 countries.
Read More
37-day RCA Cruise Met All Objectives and More
This summers’ Regional Cabled Array (RCA) 37-day expedition was one of the most complex of the seven annual Operations and Maintenance cruises to date. Not only was the expedition impacted by COVID restrictions, but it also included four Legs, a full contingent of engineers, scientists, students, and the Jason team, as well as coordinated ship operations with the R/V Thompson, the IT Integrity cable support ship, and the Ocean Exploration Trust ship the E/V Nautilus. However, thanks to the hard work of the RCA staff, and amazing support from the R/V Thompson (Captain Dave Vander Hoek) and ROV Jason teams, (Expedition Leads Ben Tradd and Mario Fernandez) the expedition was highly successful with the completion of all scheduled tasks…and more.
The expedition was led by Chief Scientists Mike Vardaro (Leg 1) and Orest Kawka (Legs 2-4), and Co-Chief Scientists James Tilley (Legs 1-3), Wendi Ruef (Leg 1 – this was the first time Ruef has sailed as a Co-Chief Scientist), Mike Vardaro (Leg 2), and Katie Bigham (Leg 4). Katie will receive her Ph.D. in 2022 from the University of Wellington, NZ. This cruise provided her a strong early career foundation for becoming a future Chief Scientist. James Tilley was the lead engineer and Larry Nielson led shore support.
COVID safety protocols significantly increased cruise complexities, which included the verification of full COVID vaccination status for all ship and science party members, ensuring that all participants sheltered-in-place, and the arrangement of COVID tests spanning both Washington and Oregon testing sites. The RCA team is highly appreciative of the exceptional support that the UW Marine Operations group provided to ensure our safety, the dynamics of crew changes, and modification of dock-side logistics in response to IT Integrity and E/V Nautilus operations.
[media-caption path=”https://oceanobservatories.org/wp-content/uploads/2021/09/PD01A_20210821_084428_recovery-scaled-1.jpeg” link=”#”]The Slope Base Deep Profiler Mooring comes aboard the R/V Thompson. Credit: M. Elend, University of Washington, V21. [/media-caption]Highlights: During the four Legs, just over 200 RCA Core and PI instruments were recovered/deployed, the Platform Interface Assemblies and Science pods on all three Shallow Profiler Moorings were turned, Deep Profiler vehicles were turned at the Oregon Offshore and Axial Base sites, and the Deep Profiler mooring was turned at Slope Base. Of particular note, the southern cable line was repaired, resulting in the return of full operational status for Primary Nodes PN1C and PN1D, providing communications and data flow once again to/from the Oregon Offshore and Shelf sites.
Over the 37 days of staging, mobilization, and demobilization for the four Legs, twenty 48 ft trailers transported 394,000 pounds of RCA equipment to and from Seattle, WA and Newport, OR. Onboard staffing included twenty-one RCA scientists and engineers, 13 ROV Jason crew, 16 students, 1 postdoc, and an artist, as well as two research scientists. During the 30 at-sea days, including two to aid in the recovery of the Ocean Exploration Trust ROV Hercules and Argus vehicle from the Endeavour Segment of the Juan de Fuca Ridge, the R/V Thompson transited ~1775 miles, 49 Jason dives were completed traversing a total of~ 125,000 meters of the water column, seven CTD casts with water sampling were completed spanning maximum cast depths of 200 m to ~ 2900 m, and two EM302 bubble plume surveys were conducted over methane seep sites at Southern Hydrate Ridge and Pythias Oasis. Finally, a new, highly active methane seep area was discovered east of the novel Pythias Oasis vent site, which has been continuously venting since its discovery in 2014.
PN1B: During Legs 1 and 2, significant and dynamic coordination was required to ensure that the R/V Thompson and C/S Integrity operations (lead by APL Engineer Chuck McGuire) were tightly coupled and that shore cranes and trucks were in place for mobilization and demobilization of both the RCA cruise gear and that associated with the recovery-repair of Primary Node PN1B. Three dives (August 5: J2-1342, and August 10-11: J2- 1342, and J2-1354) were dedicated to disconnection of cables, preparation of PN1B for recovery, and recovery of a ½ frame deployed by the Integrity, which was utilized for installation of the recovery line. The R/V Thompson-ROV Jason operations went well. Although the replacement PN1B installation could not be completed, the cable Segments 2-3 were joined and then successfully installed on August 23 – reinstating power and communications to Primary Nodes PN1C and PN1D. Unfortunately, the Southern Hydrate Ridge site will remain offline until next year, when PN1B can be reinstalled. However, joining of the segments allowed 76% of the instruments to go live again that had been offline since August 2020, as well as the Shallow Profiler and Deep Profiler moorings and BEP at the Oregon Offshore site, and the BEP and other seafloor instruments at the Oregon Shelf site.
VISIONS’21: Once again, live streaming of video and updates on the cruise were provided on the interactiveoceans website as part of the UW- RCA VISIONS’21 engagement efforts and highlights were provided on Instagram and Twitter. The 16 undergraduates that participated on the cruise worked four-hour shifts in the ROV control van, they learned how to process and analyze CTD samples, and they helped with cleaning of recovered RCA equipment (a big hit). Their enthusiasm permeated the team and their hard work contributed significantly to the cruise. We were grateful to have a resident watercolor artist onboard who shared aspects of the cruise and seafloor and biological observations through her eyes. The students shared their experiences through blogs and for many it changed their lives – a few examples of their impressions:
I found this to be a once in a lifetime opportunity and [it] offered me a broader perspective of how much preparation and consideration goes into the planning and execution of the research projects being facilitated through the OOI VISION’s expedition. It opened my eyes to the full circle of science.
This has truly been one of the coolest experiences I’ve had …. after 4 quarters of zoom classes and online labs, I’ve been so happy to finally get a feel for oceanographic research out in the field and to work with the instruments I’ve been learning about for a year and a half.
As a kid, I watched documentaries about the deep sea and imagined myself descending into the depths with the camera, sometimes sitting in a cardboard box “submarine” that I made. Being here and getting to work in the Jason van feels like accomplishing some part of that dream, and I’m very grateful to have had the opportunity to come on this trip. I’ve also come away with a better idea of how data are collected at sea, and in speaking with the scientists onboard I’ve gained a better understanding of how one goes about getting into the field.
Externally Funded Projects: The 2021 program was also another successful field season for turning, and installation, and recovery of instrumentation, and for science programs funded outside of OOI. This work included:
- The turning of NSF-funded CTDs at the ASHES hydrothermal field and at the Eastern Caldera sites, as well as installation of a new CTD at Central Caldera at the summit of Axial Seamount (W. Chadwick, Oregon State University – OCE 1928282 “Phase 2 of Enhancements to the OOI Cabled Array at Axial Seamount”). [1-day]
- The reinstallation of the University of Bremen-Germany-funded cabled overview multibeam sonar for imaging of all methane plumes at Southern Hydrate Ridge (G. Bohrmann and Y. Marcon -University of Bremen – Sonar monitoring of natural release of methane greenhouse gas from the seafloor – A contribution to the understanding of global change), the 4K camera, and turning of a CTD. [1-day]
- Installation of an NSF-funded new Pinnacle ADCP at the Central Caldera site to provide, for the first real-time, monitoring of currents throughout the entire ~1500 m water column (D. Manalang and D. Kelley, University of Washington – OCE 2129943 “RAPID: OOI-Industry Partnership to Install a Cabled 45 kHz ADCP at Axial Seamount Caldera”). This effort is in partnership with Teledyne Marine.
- Recovery of a NSF-funded self-calibrating pressure sensor at the geodetic-focused Central Caldera site (William Wilcock, University of Washington – OCE 1634103 – “A Rotating Tiltmeter for Marine Geodesy: Development and Testing at Axial Seamount on the Ocean Observatories Initiative Cabled Array”).
- A NSF-funded dive to complete site characterization, based on an ~ 1 m resolution bathymetry Sentry map, of the Pythias Oasis ridge. The dive focused on a “gully” that runs parallel to the ridge and s significant depression at the termination of the ridge (D. Kelley, University of Washington – OCE 1658201 “Collaborative Research: Pythia’s Oasis – Access to Deep Subduction Zone Fluids”). Pythias Oasis is venting fluids unlike any yet discovered in the world’s oceans. They are likely sourced at/near the plate boundary. Evidence of additional sites of seepage were discovered. [1-day]
- Three dives funded by the Bureau of Ocean Energy Management (D. Kelley, University of Washington – M21AC00009-00 “Arctic Marine Mineral Exploration – Ramen Laser Spectroscopy Validation”) at the ASHES hydrothermal field in support of the NASA InVADER program. Major and gas-tight vent fluids and several sulfide samples were recovered, and a couple microbial incubation experiments were deployed [1-day].
Recovery of the ROV Hercules and Argus Vehicle: On August 26th, the Ocean Exploration Trust ROVs Hercules and Argus became detached from the tether on the E/V Nautilus working east of the Main Endeavour Field (MEF) on the Endeavour Segment of the Juan de Fuca Ridge (2220 m). After a flurry of phone calls and Zoom meetings, the R/V Thompson, RCA, and OET (Expedition Lead Allison Fundis) teams came together for a community effort to recover the vehicles. The R/V Thompson transited ~ 10 hrs north to the MEF where there were two Jason dives to facilitate the September 2 successful recovery of the vehicles back onboard the E/V Nautilus. The effort required extension of the RCA cruise by two days, and it was a weary team that pulled back into Newport on September 3. Demobilization was complete on September 4th.
Read More