
Posts Tagged ‘Data’
Enhancing Infrastructure Usability: Updates to the OOI Platforms and Nodes Page
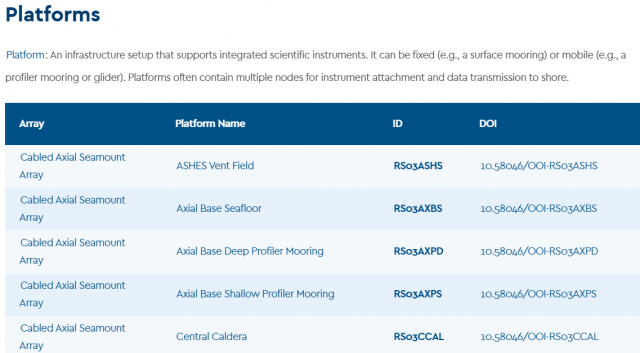
OOI has implemented a series of significant updates to its Platforms and Nodes webpage, aimed at improving sensor usage traceability, infrastructure identification, and research reproducibility. These enhancements directly support the scientific community’s need for clear, accessible metadata and a more streamline connection between OOI platforms and the data they produce.
The updated Platforms and Nodes List provides a complete and structured inventory of all deployed infrastructure across the OOI’s Coastal, Global, and Cabled arrays. Each array name links to a comprehensive description of its design, geographic focus, and research themes. Individual platforms are now associated with dedicated landing pages that correspond to their official Digital Object Identifiers (DOIs) which establishes a clear and citable connection between physical infrastructure and the data it generates.
These platform-specific landing pages serve as centralized reference hub for each infrastructure component. They include standardized citation guidance to support accurate attribution, direct access to relevant datasets and data portals, and detailed descriptions that place each platform in scientific and operational context. Each page also features a complete list of associated instruments, with links directing users to either the OOI Data Explorer or the appropriate data access interface, facilitating efficient navigation to raw and derived data streams.
These updates provide researchers with a more cohesive and transparent framework for data discovery and usage. By enabling precise cross-referencing of platforms, instruments, and datasets, the new infrastructure makes it easier to do many types of scientific research, including tracking changes over time, checking models against in situ data, studying specific ocean processes across platforms, and combining data from different platforms for more in-depth analysis.
The improvements reflect OOI’s ongoing commitment to making its data and infrastructure more FAIR (Findable, Accessible, Interoperable, and Reusable). By reinforcing the connection between deployed equipment and accessible data products, this update enhances reproducibility and strengthens the integrity of research conducted using OOI assets.
Researchers are encouraged to explore the updated Platforms and Nodes page and incorporate these resources into their data workflows, citation practices, and project planning. These tools aim to simplify the process of finding data while also enabling more detailed and meaningful research using OOI’s distributed network of ocean observing systems.
Read MoreOOI-RCA Data Team Monthly Virtual Office Hours for Data Access and Support
The Ocean Observatories Regional Cabled Array (OOI-RCA) at the University of Washington School of Oceanography is excited to introduce our monthly virtual office hours, where we’ll be available to address any data related questions, assist with data access and navigating the data visualization and download system and offer general support. Hosted by the OOI-RCA data team via Zoom, these sessions are open to all users.
Details: Monday, June 9th from 1-2pm PT/4-5pm ET
Read MoreJupyter Hub Town Hall
OOI Featured on IDEA Podcast

Have a listen in here to the IDEA Podcast where OOI’s Lead Principal Investigator Jim Edson, Senior Manager of Cyberinfrastructure Jeffrey Glatstein, and Project Manager of OOI’s Data Center Craig Risien discuss the challenges and opportunities of managing, making available, and securing OOI’s data base of 135 billion rows of stored data that grow by the minute!
The interviewers are Shannon Sheridan, Research Data Librarian at Pacific NW National Laboratory, and Briana Ezray Wham, Data Learning Center Manager and Research Data Librarian at Penn State University.
Read MoreWave Statistics from 3-Axis Motion Sensors on OOI Surface Buoys
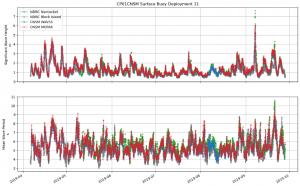
The Ocean Observatories Initiative (OOI) Pioneer Array at the New England Shelf (Pioneer-NES) collected data for nine years from November 2013 through November 2022 across the shelf break. Of the three Surface Moorings in the array (Inshore – ISSM (40.37°N, 70.88°W); Central – CNSM (40.14°N, 70.77°W); Offshore – OSSM (39.94°N, 70.89°W), only CNSM was equipped with a surface wave sensor: the Axys Technologies Tri-Axys Directional Wave Sensor (WAVSS). This meant that observations on wave data were limited to a single location within the array. Recognizing that data from a single location could be restrictive for some types of analysis, the Coastal and Global Scale Nodes Group (CGSN) identified an opportunity to increase the number of surface wave observations and extend their geographic extent to the full cross-shelf span of the Pioneer-NES Moored Array. This was accomplished by using the engineering data collected by the MicroStrain 3-axis motion sensors (MOPAK) deployed on all three surface moorings. The data collected by the MOPAKs can be used to compute the bulk and directional wave statistics at each Surface Mooring in the array.
The MOPAK sensors collected triaxial acceleration, angular rate, and magnetic orientation for 20-minutes at 10 Hz once-an-hour. These data are used to compute the buoy displacements and velocities. A zero-crossing algorithm, which identifies the number of times the buoy vertical displacement (heave) crosses zero (indicative of wave motion), is used to calculate six bulk wave statistics: significant wave height (Hsig) and period (Tsig); wave height (H10) and period (T10) of the highest 10% of waves; and the mean wave height (Havg) and period (Tavg).
The wave power and cross-spectrums are used to compute five directional wave statistics: peak wave height (Hs) and period (Tp); mean wave direction and spread; and an alternative method for significant wave height (Hm0). The MOPAK-derived wave statistics were validated against, and showed excellent agreement with, both the WAVSS dataset from the CNSM mooring and wave datasets collected by National Data Buoy Center wave buoys 44097 (Block Island, RI – 40.97°N, 71.12°W) and 44008 (Nantucket, MA – 40.50°N, 69.25°W).
[media-caption path="https://oceanobservatories.org/wp-content/uploads/2023/10/Screenshot-2023-10-31-at-3.12.55-PM.png" link="#"]Figure 1. The significant wave height (Top) and mean wave period (Bottom) at the Pioneer-NES Central Surface Mooring for Deployment 11 (Apr. 2019 – Sept. 2019) as measured by the WAVSS (blue), calculated from the MOPAK (red), and from the two nearest located NDBC buoys – Nantucket (green) and Block Island (grey).[/media-caption]The Python code to process a MOPAK dataset into a wave dataset is available to users as the process_mopak.py module in the public OOI Data Exploration GitHub repository. The wrapper function calculate_wave_statistics in the module accepts a deployment’s worth of MOPAK data and returns a new dataset with the calculated wave statistics, including attributes, units, and associated metadata, which may be saved as a new netCDF file. This process triples the number of surface wave datasets at the Pioneer-NES Array, allows for validation of the existing WAVSS wave dataset, and opens new possibilities for studying the wind-wave field across the NES-break.
We encourage users to work with the MOPAK code to generate surface wave statistics, and to submit any questions to the OOI HelpDesk.
Read More
Four-Part Series on Using Data Explorer
OOI Data Specialist Stace Beaulieu has put together a four part-series demonstrating how to use Data Explorer. In eight minutes or less per session, you can learn how to find and visualize time-series, glider, or profiler data and compare time-series data. The demos can be accessed below, on YouTube, and permanently under Tutorials on this website. Be sure to bookmark the site for future reference. A print version of the four-part series can be accessed and downloaded here.
[embed]https://youtu.be/9CA5GsGL2-0[/embed] [embed]https://youtu.be/SEwHMSyQFUg[/embed] [embed]https://youtu.be/smrSszcO4RY[/embed] [embed]https://youtu.be/ql8JvTGyrmI[/embed] Read MoreLatest Version of Data Explorer Launched May 30
OOI’s Data Science Team, working with Axiom Data Science, announced additional improvements to OOI’s data access and visualization tool, Data Explorer will publicly launch on May 30, 2023. The latest Data Explorer, version 1.5, includes a significant expansion of data availability, updates to a viewer for underway still images, and introduces a beta version of real-time streaming for cabled instruments. Version 1.5 offers new scientific data for Autonomous Underwater Vehicles (AUV) and Bio-Acoustic Sonar (ZPLS) instruments and Principal Investigator-added instrument data are now available on the site. Visitors to the site will experience optimization and new viewing capabilities for still and animated images. Additionally, data are streamed in real-time by the second for cabled instruments in the Regional Cabled Array, giving users the most up-to-date information available.
“A great deal of effort goes on behind-the-scenes to make Data Explorer be responsive to users’ needs and provide seamless, quick access to data,” explained Jeffrey Glatstein, Senior Manager of Cyberinfrastructure and OOI Data Delivery Lead at Woods Hole Oceanographic Institution. “We are grateful to our team and the developers at Axiom who continually make this already great tool, even better.”
Details about the new features are included in the following:
New Features
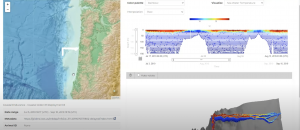
ZPLS instrument data will now be online for more locations, including the Coastal (Endurance) and Global Arrays (Argentine Basin). This is the first time this type of OOI bioacoustics sonar data have been available in an interactive visualization. This version addressed feedback received from subject matter experts to improve the data charts, including respecting time selections among sonar frequencies, changing variable names, and addresses frequency sorting. Other technical fixes have been made to the backend in response to users’ suggestions, which will help make these data more accessible.
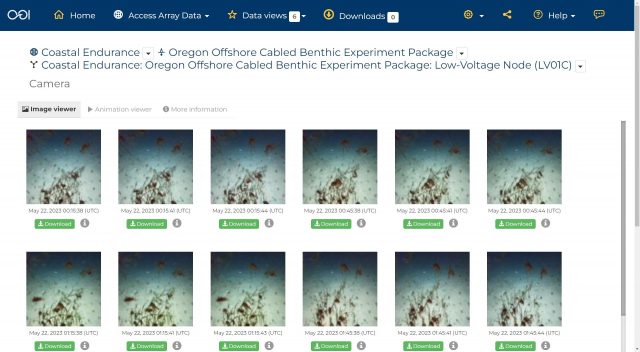
[media-caption path="https://oceanobservatories.org/wp-content/uploads/2023/05/1_1.5_zpls.jpg" link="#"]An example echogram from the bioacoustics sonar instrument on the Coastal Endurance array. The bio-acoustic sonar measures acoustic signals of plankton and zooplankton using sound waves which bounce off organisms back towards the sensor in a phenomenon known as “backscatter.”[/media-caption] [media-caption path="https://oceanobservatories.org/wp-content/uploads/2023/05/2_1.5_auv.jpg" link="#"]An example of interactive AUV data at the Coastal Pioneer Array in the Data Explorer. The travel trajectory of the AUV across the shelf-break is shown in the map. Data collected by the instrument as it dives from the sea surface to a maximum depth of 600m is shown in the chart on the right. Users can visualize data in 3-D across the water column in the lower interactive chart.[/media-caption]A media server will now be up and running on Data Explorer. In this version, updates have been made to improve the performance of the still image viewer. All image collections are shown in a Grid view which makes seeing what is available easier. Camera metadata is now available via a more information tab. Images will also be available on the pages included in time series. Images will also be available as a single image or in animation viewer. Full size images are presented with an image scale and available for download.
[media-caption path="https://oceanobservatories.org/wp-content/uploads/2023/05/3_1.5_image-viewer.jpg" link="#"]Cameras are attached to instruments on the cabled infrastructure of the OOI Regional Cabled Array. These long-term imagery records are now available in the Data Explorer for viewing and download to help understand life in deep water and coastal environments. The camera at Endurance Offshore is designed to look at the seafloor in general, observing animal activity, sediment transport, detritus falls, and bioturbation.[/media-caption] [media-caption path="https://oceanobservatories.org/wp-content/uploads/2023/05/4_1.5_image-viewer.jpg" link="#"]The media viewer in the Data Explorer allows users to pan and expand images, select images across a timeseries, view camera metadata, download images, and animate images across time.[/media-caption]Another added beta media feature is real-time streaming of Cabled Array instrument data. The design of this function is meant to be user-friendly. A Grid view shows available real-time streaming instruments. A Single view shows a real-time streaming chart, with data from the last 24 hours. These features are available from Data Explorer’s landing page with further explanations of what data are available and when.
Added Glatstein, “We invite all OOI data users to try out these new components and continue to provide us feedback. We are particularly eager to hear the community’s response to the beta version of the media server so we can tweak that as needed.”
[media-caption path="https://oceanobservatories.org/wp-content/uploads/2023/05/5_1.5_real-time.jpg" link="#"]An example of real-time streaming data now available for instruments on the Regional Cabled Array. This network of >100 cabled instruments and instrumented moorings transmit data to shore in real-time via fiber optic technology. Users can view and interact with new data every second as it is streamed from the deep ocean to shore.[/media-caption]
Read More
Update on RCA Broadband Hydrophone Data Availability, File Formats, and Directory Structure
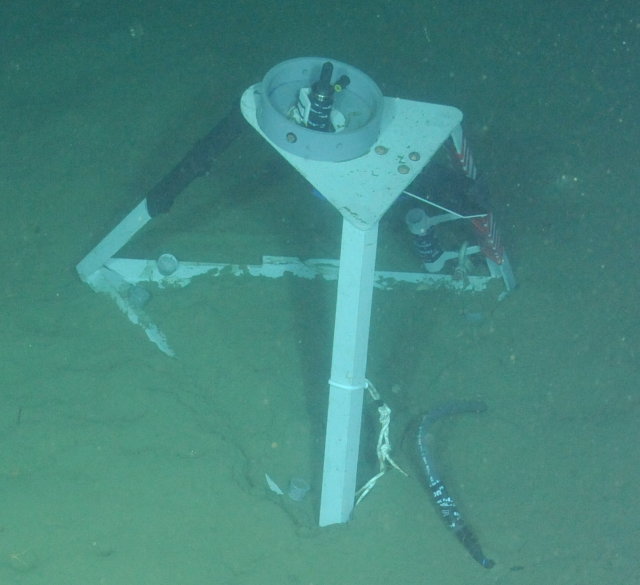
As part of continuing OOI data process improvements, the RCA Data and OOI Software Development Teams have been working closely to expand data availability and improve data file consistency for six Broadband Hydrophones (HYDBBs) located at Axial Base (2), Slope Base (2), and Oregon Offshore (1) and Shelf (1) sites. Additional details are available on these study sites and instruments at these links.
A system update will go live at 17:00 UTC June 7, 2023 and will affect all HYDBB data posted on the Raw Data Archive server after that date. In the near future, the updates will also be applied to historical HYDBB files previously posted on the Raw Data.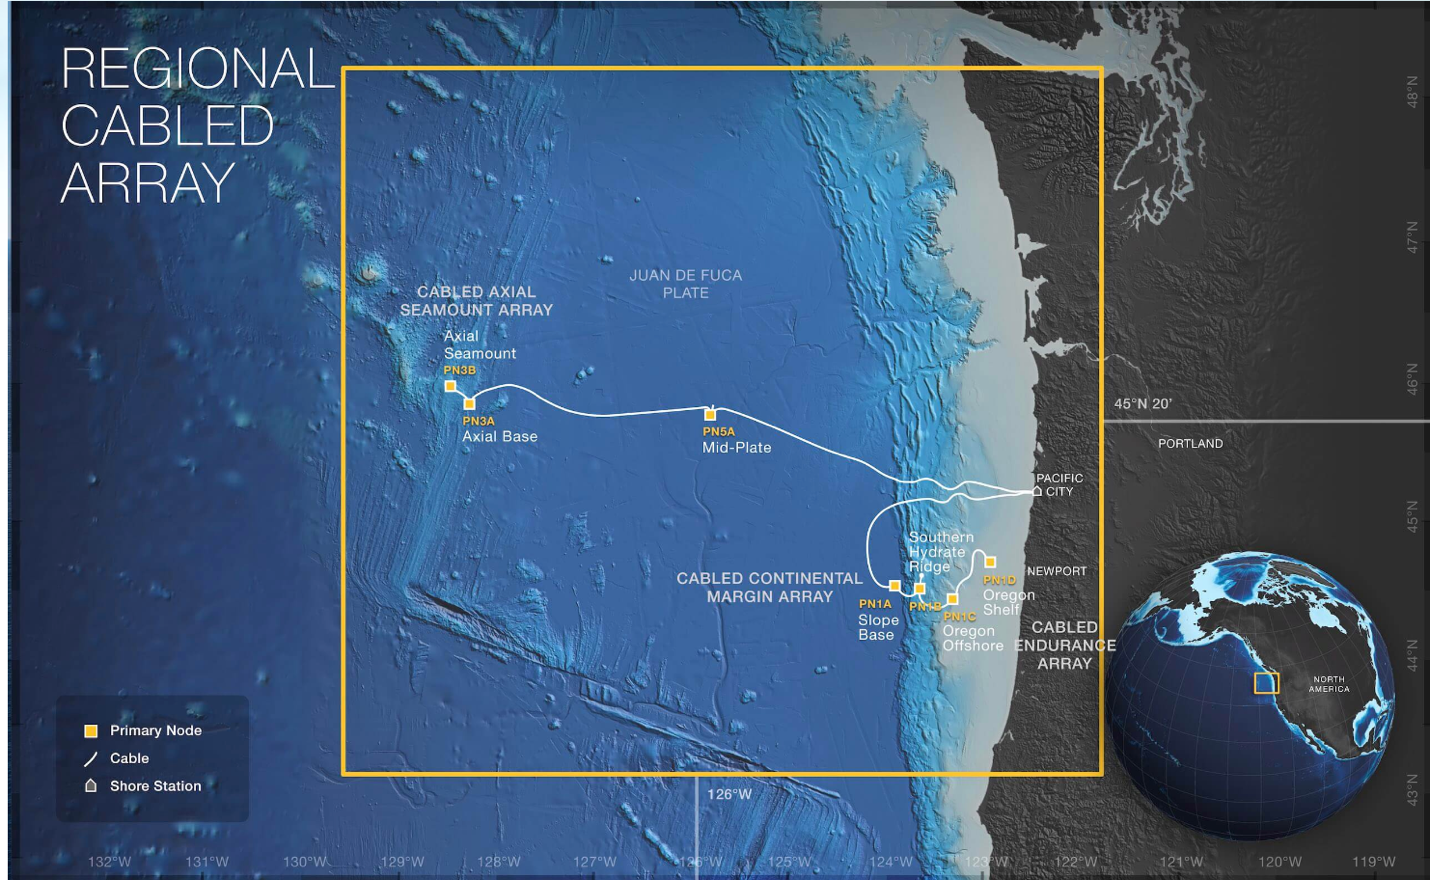
OOI HYDBB data are currently provided to the public on the OOI Raw Data Archive server as MiniSEED-formatted files (extension “.mseed”). This lossless, compressed format is a subset of the Standard for the Exchange of Earthquake Data (SEED) that is in extensive use for archiving and serving seismological data (see IRIS). The HYDBB MiniSEED files are served on the Raw Data Archive in daily subdirectories organized by year and month for each of the sites:
- Axial Seamount – Axial Base
- Continental Margin – Slope Base
- Continental Margin – Oregon Offshore
- Continental Margin – Oregon Shelf
Once the system update goes live on June 7, all HYDBB data posted on the Raw Data Archive server after this date will have the following enhancements:
- Currently, only HYDBB data arriving at the OOI data repository in near real-time are provided to the public in the daily subdirectories, updated at nominal 5-min intervals. After the system update, data arriving at the OOI repository after Navy review will also be made available on the Raw Data Archive. These delayed and previously publicly unavailable data will be provided as analogously named MiniSEED datafiles but in separate subdirectories named “addendum” under each daily directory.
- Each individual MiniSEED file will include HYDBB data over fixed 5 min timespans, starting at 00:00 UTC and repeated at subsequent 5 min intervals (beginning at 00:05, 00:10 UTC, etc.). If no data are available for a specific 5 min timespan, the datafile will not be created. Any gaps in the data stream during each 5 min timespan are accounted for by the use of the multi-trace extension of the MiniSEED file format construct, which allows multiple temporal segments within a single file. Previously, each HYDBB file on the Raw Data Archive contained only a single continuous trace of data. An example Python toolbox for accessing/processing such MiniSEED data is available, with additional information on the ObsPy open-source project here.
This change in file construction will allow for more efficient access and delivery of HYDBB data, particularly when there are small and frequent gaps in the data streams which can lead to excessive file fragmentation, as was often the case with these data before this system update.
If you have any questions, please contact the OOI HelpDesk or post your question on the public OOI Discourse Forum.
Read More
OOI Data: An Ever Growing Userbase

The collection, archive, and delivery of high-quality oceanographic data to the scientific community is central to the mission of the Ocean Observatories Initiative’s (OOI). Researchers world-wide are taking advantage of the 134 billion rows of freely available OOI data to make discoveries about the oceans and atmosphere. Funded by the National Science Foundation (NSF), the OOI was designed to collect and serve ocean data for up to 30 years. The 30-year timescale makes it possible to measure and observe both short-lived episodic events and longer-term changes occurring in the ocean. Such data are critical to increasing knowledge about ocean processes and if and how the ocean is changing.
How OOI Data Are Being Used
Since OOI data are freely available to anyone with an internet connection, researchers in organizations ranging from small land-locked colleges to major international oceanographic institutions are using OOI data in their scientific investigations. The next generation of ocean scientists are increasingly using OOI data as evidenced by the topics of PhD dissertations and honor theses. The Ocean Data Labs Project also has inspired thousands of students and their college professors to integrate real-time ocean data in the classroom. The project published an OOI Lab Manual, designed for use in introductory oceanography courses providing students and teachers the opportunity to apply timely and even real-time oceanographic data into their studies.
OOI has a broad and increasing science user base, as reflected in the number of OOI-related publications that advancing scientific understanding of ocean processes. The OOI-related publications and the Web of Science citation statistics are compiled by the WHOI-Marine Biological (MBL) Library through Web of Science and Dimensions searches on the main literature databases. The search terms include keywords such as “Ocean Observatories Initiative”, “Irminger Sea Array”, “Global Station Papa”, “Pioneer Array”, “Coastal Pioneer”, “OOI Pioneer”, “Endurance Array“, “Regional Cabled Array”, etc. The subset of publications using OOI data is identified by the OOI PI team. A complete, searchable list of OOI-related publications can be found here.
Table 2: Publications and NSF awards from 1 January 2013 through 31 March 2023
|
Metric |
OOI-related publications in refereed journals | Subset of publications using OOI data or infrastructure |
NSF Awards |
| Number of publications or awards | 326 | 177 | 129 total $66.4M |
| Total Web of Science citations | 4295 | 2250 | Not applicable |
| Sum of Altmetrics scores | 4679 | 2795 | Not applicable |
| Distinct lead authors or PIs | 263 | 146 | 96 |
| Distinct lead institutions | 143 | 73 | 49 |
| Countries | 24 | 16 | USA only |
This process does not necessarily capture all publications that use OOI data, particularly publications that use data obtained from third-party sites that ingest and serve OOI data (e.g., IRIS, Glider DAC and GOA-ON) that would not fall under our keywords. OOI is actively working to improve our ability to identify OOI-related publications by minting DOIs for our data sets.
Even so, this past year’s total for OOI-related publications is the largest to date. The resulting statistics show that OOI data and its infrastructure has been used in 177 peer-reviewed publications since 2013 and has been described, mentioned and/or motivated research in 147 others as shown in Table 1. The number of publications has grown steadily since 2013 as shown in Figure 1. The total given for 2023, represents the first quarter of that calendar year, and we are on tract to meet or beat last year’s total.
[caption id="attachment_26011" align="aligncenter" width="900"]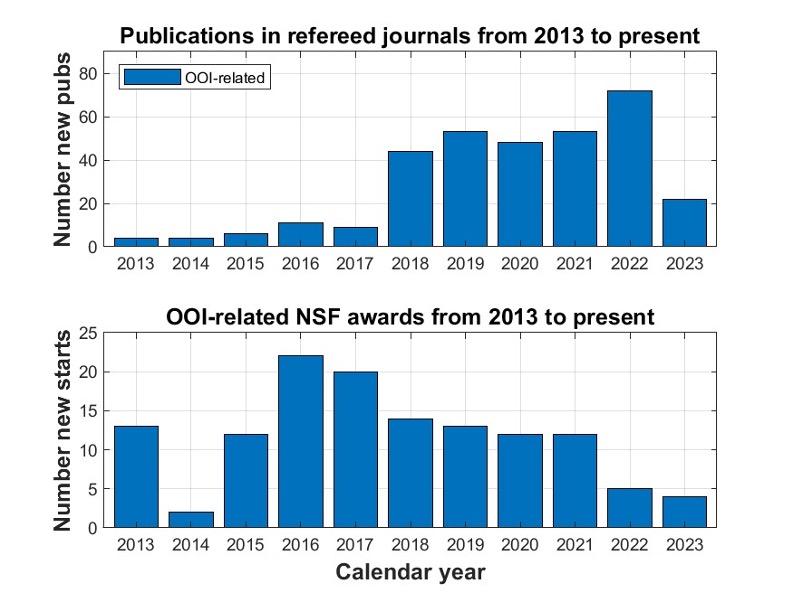
Figure 1. (top panel) the number of publications in refereed journals by year. (bottom panel) The number of OOI-related NSF grants by year. They do not include those grants that support OOI operations and maintenance (O&M).[/caption]
The OOI funding information is obtained from the NSF website by searching awards for “Ocean Observatories Initiative” in their abstracts, selecting those with greater than a particular percentage of relevance and rejecting outliers (such as the OOI O&M and OOIFB awards). Our searches use a cutoff for percentage of relevance of 68%, which provides a meaningful comparison of OOI-related NSF awards from 2013 to the present. The OOI was commissioned in 2016, coincident with the significant jump in NSF-funded OOI-related awards shown in Figure 1. Since that time, the number of awards has slowly dropped, possibly due to impacts from COVID-19. Interestingly, the decrease in NSF awards coincided with rapid growth in publications. We can think of several reasons for this including:
- The freely available OOI data that can be used directly for research without a dedicated NSF (or other) award.
- The use of other funding sources to analyze and publish OOI data.
- The need to expand our search to include other keywords in addition to “Ocean Observatories Initiative.”
We believe that all three play a role in the number of new starts supported by the NSF. This is particularly true of reason (2) for which there is clear evidence in the A Growing Global Reach section provided below.
Improved Accessibility
The OOI has developed an easy-to-use tool to explore and visualize OOI data known as Data Explorer, which was launched in October 2020. The number of users using this tool has been on a steady trajectory of growth since its inception. For example, Figure 2 shows the number of
[caption id="attachment_26014" align="aligncenter" width="900"]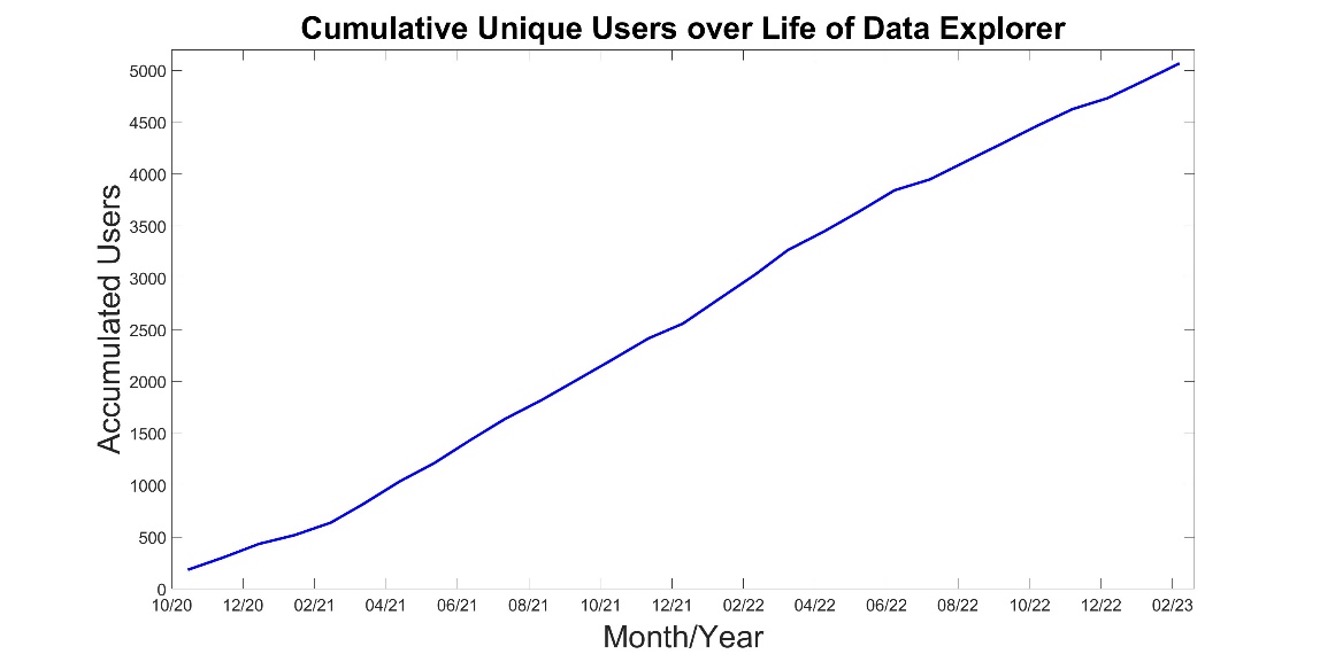 Figure 2. A time series of the accumulated number of unique users since the roll out of Data Explorer in October, 2020. Note, these numbers do not include users who access OOI data via outside data aggregators/distributors such as IRIS, NDBC, IOOS, and the GOOS Glider DAC.[/caption]
OOI Data Explorer unique users since its launch date. A unique user is defined as an individual that comes to the Data Explorer website at least once as defined by Google Analytics. Note that each user is counted only once, i.e., a person who visits Data Explorer a hundred times is counted as one unique user. Today, over 5000 individuals are using our Data Explorer user interface, which represents an average of 175 new users per month. It should also be noted that this total represents the minimum number of OOI users as many long-time users of OOI data continue to use the OOI Data Portal, M2M, our THREDDS and ERDDAP servers, and OOI seismic and hydrophone data from IRIS.
Everyone Benefits
The OOI is not funded to conduct research with OOI data. The OOI’s infrastructure is maintained and operated by Marine Implementing Organizations (MIOs) at WHOI, Oregon State University (OSU), and the University of Washington (UW). These MIOs represent three of the largest oceanographic institutions in the United States and, as expected, researchers in these institutions actively incorporate OOI data in their research (and education). However, they are clearly joined by researchers from many other institutions who also use OOI data as the basis of their scientific findings at shown by Figure 2. This figure shows that three-quarters of publications citing the OOI come from non-MIO institutions, while two-thirds of NSF awards for OOI research goes to non-MIO institutions. It should be noted that the NSF Awards do not include OOI Operation and Maintenance support (O&M) from NSF; i.e., it is just the NSF research grants that mention OOI.
[caption id="attachment_26016" align="aligncenter" width="898"]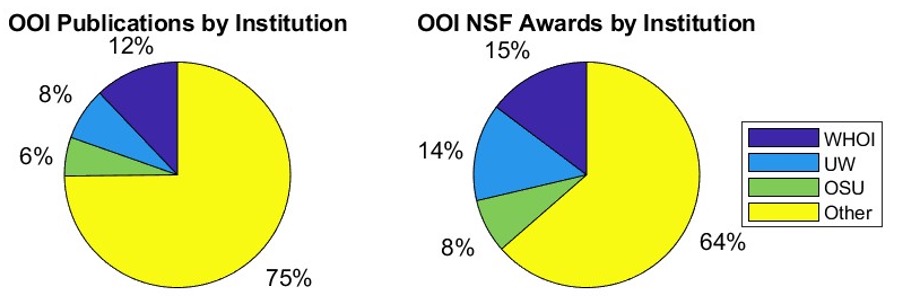 Figure 3. Pie charts showing publications and awards by institutions.[/caption]
A Growing Global Reach
OOI’s global reach is wide and deep. Researchers in 22 countries are using OOI data as shown in Table 1. The global accessibility of ocean data to anyone with an Internet connection allows researchers in land-locked countries and States to study the ocean, without having ever to go to sea. To wit, nations other than the United States are increasingly supporting OOI-related research, as reflected in Figures 4. While the NSF is listed as the source of funding for nearly 40% of the publications shown in the Figure 1, the contributions of other federal agencies, foundations, and nations continue to grow, reflecting the value of the data generated by this vital ocean observatory.
This is even more pronounced if the funding sources are broken down by period. For example, Figure 5 shows the funding source statistics prior to and post CY2019. Approximately half of the publications acknowledge NSF funding from 2013 through 2019. The NSF is acknowledged in approximately one-third of the publication since the start of 2020, which is consistent with the results from Figure 1 (bottom panel). The number of publications that do not acknowledge a source of funding has grown from 4% to 7%, which suggests a growing number of researchers using the freely available data without support. A quick look at these publications shows that several of these are PhD theses. The number of papers acknowledging NSF support is still significant, suggesting that our search is missing some of the new starts and should be modified. More importantly, however, the decrease in NSF acknowledgements coincides with a substantial increase in the acknowledgements of support by European and other countries in their published research. The enhanced stature of the OOI as a global research observatory has resulted in growing collaborations with other observing initiatives such as GOOS, POGO, SOLAS, IOOS and SCOR.
[caption id="attachment_26018" align="aligncenter" width="670"]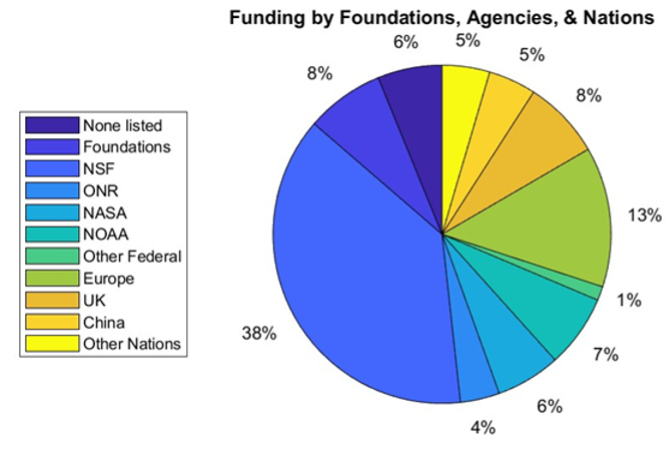 Figure 4. A pie chart showing the foundations, agencies and nations providing support for OOI-related research. Note that the percentages reflect the number of times that these funding sources were acknowledged compared to the total acknowledgements and do not represent the amount of actual funding.[/caption]
[caption id="attachment_26019" align="aligncenter" width="932"]
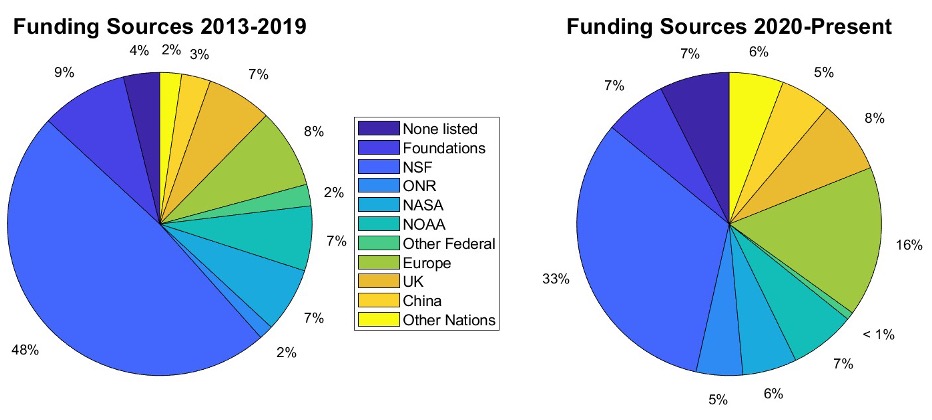 Figure 5. As in Figure 3 but divided into two periods showing acknowledgement of support through 2019 and thereafter.[/caption]
Data Users’ Views
What better way to assess the potential of OOI data than to ask researchers who use it as a foundation for their scientific findings? We share with you some of the views of OOI data users below:
Value of Long-Term Time Series
“The OOI Program offers the opportunity to compare detailed time-series observations of the biological pump across multiple sites, complementing both ship-based process studies (e.g., EXPORTS; Siegel et al., 2016) and more globally wide-spread observations from Biogeochemical-Argo floats and satellites. The OOI arrays represent a diverse set of complementary physical and biogeochemical settings that together could be used to better constrain how interactions between biological and physical processes influence the biological pump.”
– Hilary I. Palevsky, Dept. of Earth & Environmental Sciences, Boston College, Boston, MA, USA
“High resolution and bandwidth ocean observing data from myriad, co-located instrument arrays, such as those provided by the RCA, are crucial to building time series spanning months or years that are required to quantify the flux of methane from the seafloor, possible impacts of ocean warming and seismic events, and the evolution of these highly dynamic environments. Short term or nonsystematic monitoring systems do not provide enough data to produce statistical correlations, nor detect low-frequency cycles with high degrees of confidence. In the years to come, we plan to achieve longer time-series to detect potential non-periodic, low-amplitude influences, possibly from climatic forcing. Such influences can only be reliably inferred with the kind of long-term, systematic sampling methodology made possible by the OOI observatory.”
– Yann Marcon, MARUM – Center for Marine Environmental Sciences, University of Bremen, D-28359 Bremen, Germany
“The six-year record of real-time data flowing from the Regional Cabled Array forms an unparalleled foundation on which to build an ocean drilling program with the International Ocean Discovery Program to understand the relationships between microbial, hydrological, geochemical, and geophysical processes in zero-age, hydrothermally active oceanic crust. Proposed Axial drilling will provide a unique opportunity to determine the nature of subseafloor hydrological properties and develop an unprecedented 3-D understanding of subseafloor processes in unsedimented crust.”
– Julie A. Huber, Marine Chemistry and Geochemistry, Woods Hole Oceanographic Institution, Woods Hole, MA
“The OOI Oregon Shelf site is part of the Coastal Endurance Array. This site, also known as NH-10 as it is located 10 nautical miles offshore along the historic Newport Hydrographic Line, is embedded in the Northern California Current System (NCC). The NCC supports ecologically and economically important fisheries and other marine resources that are impacted by major climate fluctuations: marine heat waves, El Niño, seasonal hypoxia, ocean acidification, and changes in the timing of spring transition to upwelling and fall transition to downwelling. To quantify these types of anomalous events against a baseline of ‘normal’ conditions, we first need decades-long time series to establish what ‘normal’ is (or was). The OOI data collected at the NH-10 site enable us to form these decades-long time series by extending velocity, temperature, and salinity time series from previous programs at NH-10. Together, the OOI data and earlier data form time series that do go back decades, which are very rare for subsurface oceanographic data. The resulting time series can be used to better understand local and basin-scale forcing of physical and biological processes at intra-seasonal, seasonal, interannual, and decadal time scales, as well as detect long-term changes and trends embedded within such variability.”
– Melanie Fewings, College of Earth, Ocean, and Atmospheric Sciences, Oregon State University, Corvallis, OR, USA
Providing Data to Assess Climate Change
“The OOI’s Global Irminger Sea Surface Mooring provided the first multi-winter observations from a high northern latitude surface flux buoy and related them to both localized (100-500 km) intense weather conditions and larger scale (~3000 km) modes of atmospheric variability. The data allowed us to create the first multi-winter characterization of air-sea exchange in the high latitude North Atlantic from observations, including year-to-year variability in the influence of the Irminger Sea tip jet on winter heat loss. We were able to identify a new mechanism by which the atmosphere controls ocean heat loss leading to dense water formation. The results are particularly important as the connection between air-sea exchanges and the ocean circulation is still poorly understood, hindering attempts to understand climate change induced slowdown of the Atlantic circulation and its climate feedbacks.
– Simon A. Josey, National Oceanography Centre, Southampton, UK:
“An important priority for the scientific community is reducing uncertainty in our current quantification of Southern Ocean air-sea CO2 flux and developing the capacity to both predict and monitor how air-sea CO2 flux in this region may change under future climate change. The suite of biogeochemical sensors that were deployed on the OOI Southern Ocean surface mooring provide a unique opportunity to make advances in this quantification of carbon fluxes. In particular, the mooring data provide a valuable opportunity to validate and complement other Southern Ocean in situ carbon system measurements, particularly from biogeochemical Argo floats, as they provide in situ measured wind/atmospheric variables needed to calculate carbon fluxes, high temporal frequency not available on other platforms.”
– Veronica Tamsitt, Climate Change Research Centre, University of New South Wales, Sydney, NSW, Australia and Centre for Southern Hemisphere Oceans Research, CSIRO Oceans and Atmosphere, Hobart, TAS, Australia
“The Regional Cabled and Coastal Endurance Array profiling current meter and CTD data are an incredible novelty for internal tide (ITs) studies, enabling the delineation of the relative contributions of many processes that provide pathways for energy through the ITs and dissipation and mixing. The long duration enables discrimination of processes in frequency that have very similar frequencies, and calculation of the impacts of intermittent inertial waves, long period currents (e.g., eddies; upwelling), and seasonal stratification changes on the shear, strain, and turbulent mixing associated with the ITs. The high vertical resolution enables the differentiation of reversible (i.e., vertical advection) and irreversible (i.e., diapycnal mixing) processes, based on tidal isopycnal displacements. In short, the OOI data offer an incredible opportunity to better understand the critical role ITs play in determining the meridional overturning circulation and oceanic heat budget.”
– Douglas S. Luther, School of Ocean and Earth Science and Technology, University of Hawai’i at Manoa, Honolulu, HI, USA
Improved Understanding of Ocean Processes
“The seismic, geodetic, and hydrothermal data from the OOI Regional Cabled Array at Axial Seamount continues to provide my research group with the opportunity to participate in a thriving community seeking to understand the inner workings of a submarine volcano. The OOI RCA at Axial seamount also provides the long-term observations that help anchor a wide variety of complementary observational studies.”
– William S.D. Wilcock, School of Oceanography, University of Washington, Seattle, WA, USA
“The OOI Pioneer Array at the Mid-Atlantic Bight (MAB) shelf edge provides a unique opportunity for studying subsurface offshore transport of the shelf water. One example is that Pioneer Array moored profilers and gliders captured clear signals of frontal subduction of the shelf water on the edge of an impinging warm-core ring. The subducted shelf water was carried offshore by the anticyclonic ring flow underneath a surface layer of ring water and is invisible on the ocean surface. This form of offshore transport of shelf water had not been realized previously. We used the water mass characteristics captured by the Pioneer Array to develop an ocean model to study the dynamics of the frontal subduction and to quantify the surface-invisible part of the shelf-water offshore transport. Future analysis of Pioneer Array data can provide a more robust quantification of the cross-shelf exchanges at the shelf break and the influence of warm-core rings on the physical and biological properties of the MAB continental shelf.”
– Weifeng (Gordon) Zhang, Applied Ocean Physics & Engineering, Woods Hole Oceanographic Institution, Woods Hole, MA, USA
“At Axial Seamount, the OOI infrastructure combined with constraints on the architecture of the magma plumbing system, provides the opportunity to tie dynamic volcano processes of magma recharge and eruption directly to individual magmatic structures imaged within the volcano interior. It provides the opportunity to answer important questions about how and where melt accumulations form, how melt is transported through the lower crust to feed shallower reservoirs, and how eruptions are triggered. Studies of the deep magma plumbing, conducted within the framework of the even higher-resolution 3D multi- channel seismic imaging data recently acquired at Axial Seamount (Arnulf et al., 2019), would be unprecedented for at any volcano on Earth.”
– Suzanne M. Carbotte, Lamont-Doherty Earth Observatory, Columbia University, Palisades, NY, USA
“Using 4-Dimensional Variational Data Assimilation in a ROMS model (Regional Ocean Modeling System), we undertook a 4-year reanalysis (2014- 2017) of circulation at the Pioneer Coastal Array site. Starting from a 7-km resolution model identical to the MARACOOS ocean forecast system, we refined the resolution through two nested grids to achieve ~700 m horizontal grid resolution in a domain that fully encompasses Pioneer. Though an order of magnitude fewer in number, in situ observations of temperature and salinity from Pioneer moorings and gliders had two to three times the impact of satellite sea level and temperature data on modeled across-shelf fluxes. The study shows that it is feasible to compute very-high-resolution ocean reanalyses that are meaningfully constrained by dense observing networks such as Pioneer. Achieving event-wise correspondence between observed and modeled sub-mesoscale features can provide context to the interpretation of other Pioneer data and opens further opportunities, such as coupling circulation to companion models of biogeochemical and ecosystem processes.”
– John Wilkin, Department of Marine and Coastal Sciences, Rutgers University, New Brunswick, NJ, USA
Read More
OOI Launches QARTOD
WHAT IS QARTOD?
As part of the ongoing OOI effort to improve data quality, OOI is implementing the Quality Assurance of Real-Time Oceanographic Data (QARTOD) on an instrument-by-instrument basis. Led by the United States Integrated Ocean Observing System (U.S. IOOS), the QARTOD effort draws on the broad oceanographic observing community to provide manuals for different instrument classes (e.g. salinity, pH, or waves), which outline best practices and identify tests for evaluating data quality. A common code-base is available on GitHub and actively maintained by IOOS partner Axiom Data Science.
OOI has committed to implementing available QARTOD tests where appropriate. QARTOD is well-documented and actively maintained with an engaged user-base across multiple data collection and repository programs. It has a publicly available code-base with standardized tests and flag definitions that result in simplified, easy-to-interpret results. However, some instruments deployed by OOI, such as seismic sensors, hydrophones, and multispectral sensors, are not well-suited towards QARTOD. For instruments for which there is no existing QARTOD manual, such as seawater pCO2, OOI is implementing “QARTOD-like” quality control (QC).
HOW ARE QARTOD RESULTS COMMUNICATED?
QARTOD utilizes a standardized data-flagging scheme, where each data point for an evaluated variable (e.g. salinity) receives one of the following flags: 1 if the data point passed the test and is considered good; 2 if a test was not evaluated; 3 if the data point is either suspect or interesting/unusual; 4 if the data point fails the test; 9 if the data point is missing. Importantly, QARTOD only Flags data, it does not remove data. In fact, OOI is committed to delivering all available data, whether good or bad; the goal is to provide further information on the possible quality of the data. Furthermore, a flag of 3 does not necessarily mean a data point is bad – it could also mean something interesting or unusual occurred that resulted in the given data point being outside of the expected test threshold.
HOW IS QARTOD IMPLEMENTED BY OOI?
OOI is prioritizing implementation of QARTOD on instruments and variables which are shared across arrays and with broad or high scientific interest, such as CTDs, seawater pH and pCO2, dissolved oxygen, and chlorophyll/fluorescence. OOI is currently implementing the gross range and climatology tests (see this article for a more detailed description of the specific implementation). Note that the climatology test is a site-specific seasonally varying range test and not a World Ocean Atlas-like climatology. These two tests, in addition to other tests under development, utilize thresholds and ranges which are calculated from existing OOI datasets. The code used to calculate the thresholds is publicly available at the oceanobservatories ooi-data-explorations github repository and resulting threshold tables are available at the oceanobservatories qc-lookup github repository. The tests executed and results are added to the datasets as variables named _qartod_results and _qartod_executed, with the relevant tested data variable name prepended (e.g. practical_salinity would be practical_salinity_qartod_results and practical_salinity_qartod_executed). The _qartod_executed variable is a list of the individual results of each of the tests applied stored as a string. The tests applied and the order in which they were applied are stored in the variable metadata attributes. The _qartod_results provide a summary result of all the tests applied.
WHAT IS THE CURRENT OOI QARTOD STATUS?
The IOOS QARTOD manuals define the tests for each instrument class as “Required,” “Recommended,” and “Suggested”. The OOI priority will be the “Required” tests for each instrument class in use by OOI. “Recommended” and “Suggested” test development will be reviewed, with the support of subject matter experts, in the future. The IOOS QARTOD manuals can be found at Quality Assurance/Quality Control of Real Time Oceanographic Data – The U.S. Integrated Ocean Observing System (IOOS).
Current tests under development are gross range (GRT) and climatology (CT). The gap test (GT) will follow next. The syntax and location tests are considered operational checks and are handled within OOI operations and management systems. QARTOD test data will be available in specific locations where OOI supplies data, starting with M2M, and then propagated to THREDDS and Data Explorer. The current status of QARTOD test development and availability is shown in Table 1.
[media-caption path="/wp-content/uploads/2022/10/QARTOD-Table-1.png" link="#"]Table 1: Current Status of Development & Availability[/media-caption]
[media-caption path="/wp-content/uploads/2022/10/QARTOD-Figure-1.png" link="#"]Figure 1: QARTOD “Required” Test Development Timeline[/media-caption]
Read More